March 19, 2026 a 05:08 am

CHFJPY: Fibonacci Analysis
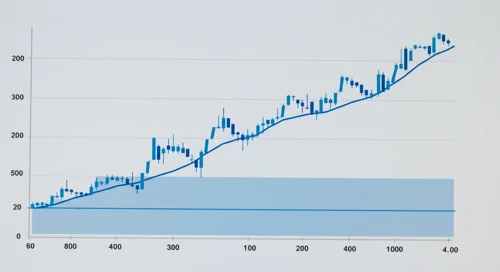
The CHFJPY currency pair has recently demonstrated an upward trend, recovering from its lows. This pair exhibits potential volatility due to global market influences, and the yen's reaction to economic news in Japan or Switzerland could lead to significant fluctuations. Identifying the retracement levels is vital for anticipating potential price targets.
Fibonacci Analysis
An analysis of the CHFJPY currency pair indicates a dominant upward trend from February 16, 2026, to March 18, 2026. During this period, the highest price reached was 203.638 on March 1, 2026, and the lowest was 199.019 on February 17, 2026. Using these points, we calculate the Fibonacci retracement levels.
| Level | Price |
|---|---|
| 0.236 | 200.783 |
| 0.382 | 201.523 |
| 0.500 | 201.828 |
| 0.618 | 202.133 |
| 0.786 | 202.559 |
The current price of CHFJPY is 201.567, placing it within the 0.236-0.382 retracement zone. This suggests potential resistance ahead, as traders may use these levels as potential selling points.
Technical Interpretation: If the pair manages to break through this retracement zone, it could aim for higher Fibonacci levels, possibly confirming the continuation of the upward trend. However, failure to do so may lead to a reversal or consolidation.
Conclusion
The upward trend in CHFJPY suggests a positive momentum in favor of the Swiss Franc over the Yen. As the current price hovers in a key Fibonacci retracement zone, traders should closely monitor for a breakout or reversal. The pair's next move could signal either further gains or a pullback as it tests resistance levels. For analysts, this setup provides crucial insights into potential trades, balancing opportunities against the inherent risks of forex volatility. Given the current global economic climate, maintaining a cautious yet opportunistic approach is advisable in trading CHFJPY.