October 23, 2025 a 05:08 am# CHFJPY: Fibonacci Analysis
 ## Fibonacci Analysis
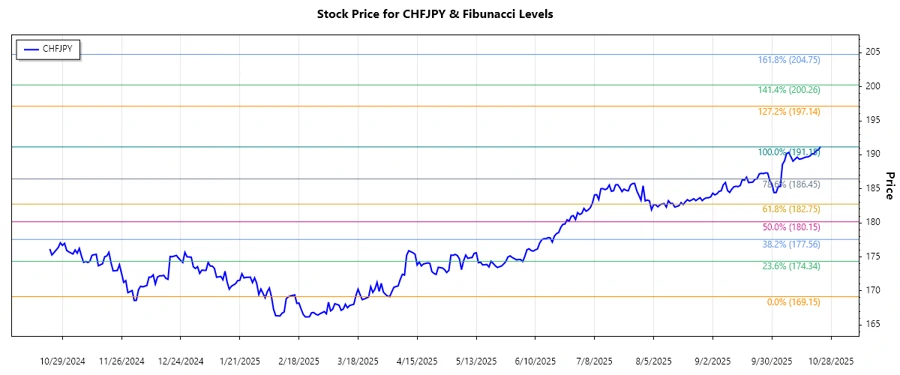
The analyzed data reveals a dominant upward trend starting from the beginning of April 2025. By analyzing the high and low points within this trend, we identify the key Fibonacci retracement levels.
Start Date: 2025-04-01
End Date: 2025-10-23
High Point: 191.154 on 2025-10-23
Low Point: 169.151 on 2025-04-02
Fibonacci Levels:
## Fibonacci Analysis
The analyzed data reveals a dominant upward trend starting from the beginning of April 2025. By analyzing the high and low points within this trend, we identify the key Fibonacci retracement levels.
Start Date: 2025-04-01
End Date: 2025-10-23
High Point: 191.154 on 2025-10-23
Low Point: 169.151 on 2025-04-02
Fibonacci Levels:
Current Price: 191.154
The current price of 191.154 suggests that CHFJPY has surpassed typical Fibonacci retracement levels, indicating a potential breakout above resistance levels. This could imply growing bullish momentum.
Additionally, the level of 189.597 previously acted as a resistance zone, which may now serve as support, highlighting potential areas of interest for further price movement.
 ## Conclusion
The CHFJPY continues to exhibit bullish characteristics, with the currency pair exceeding traditional Fibonacci retracement levels, signaling potential further gains. However, traders should be vigilant of market corrections or geopolitical events that could impact currency volatility. The current setup suggests a favorable opportunity for bullish traders, provided that resistance levels are sustained. Analysts will continue to monitor economic indicators and market sentiment as crucial data points in projecting future paths for the CHFJPY pair.
## Conclusion
The CHFJPY continues to exhibit bullish characteristics, with the currency pair exceeding traditional Fibonacci retracement levels, signaling potential further gains. However, traders should be vigilant of market corrections or geopolitical events that could impact currency volatility. The current setup suggests a favorable opportunity for bullish traders, provided that resistance levels are sustained. Analysts will continue to monitor economic indicators and market sentiment as crucial data points in projecting future paths for the CHFJPY pair.
CHFJPY: Fibonacci Analysis
The CHFJPY currency pair has shown significant movement throughout the analyzed period, exhibiting a steady upward trend. As the global economic landscape continues to evolve, the strength of the Swiss Franc relative to the Japanese Yen remains a focal point for investors. Technical indicators suggest that the pair may be approaching key resistance levels, warranting close attention from traders.
| Level | Price |
|---|---|
| 0.236 | 174.707 |
| 0.382 | 178.678 |
| 0.5 | 182.152 |
| 0.618 | 185.625 |
| 0.786 | 189.597 |
## Conclusion
The CHFJPY continues to exhibit bullish characteristics, with the currency pair exceeding traditional Fibonacci retracement levels, signaling potential further gains. However, traders should be vigilant of market corrections or geopolitical events that could impact currency volatility. The current setup suggests a favorable opportunity for bullish traders, provided that resistance levels are sustained. Analysts will continue to monitor economic indicators and market sentiment as crucial data points in projecting future paths for the CHFJPY pair.
Smart Data Insight
Master the Perfect Entry & Exit for this Stock
Don't leave your profits to chance. Historically, this stock follows specific seasonal patterns that institutional traders use to maximize returns.
- ✅ Identify the "Golden Buying Window"
- ✅ Avoid high-risk correction cycles
- ✅ Backtested data from the last 20+ years