September 04, 2025 a 05:08 am
CHFJPY: Fibonacci Analysis
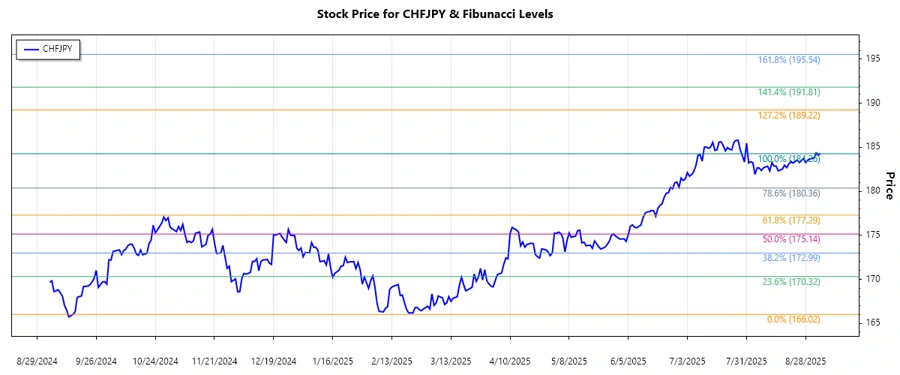
CHFJPY has shown significant movements over the past months. The pair experienced a clear uptrend, reaching a peak in early September 2025. This analysis determines key Fibonacci retracement levels, which can provide potential support or resistance areas for future price movements. Traders may find these retracement levels useful in identifying possible trading opportunities.
Fibonacci Analysis
| Detail | Information |
|---|---|
| Trend Start Date | 2024-09-04 |
| Trend End Date | 2025-09-04 |
| High Point | 184.262 on 2025-09-04 |
| Low Point | 166.01976 on 2024-09-15 |
Fibonacci Levels
| Level | Price |
|---|---|
| 0.236 | 179.7863 |
| 0.382 | 176.9859 |
| 0.5 | 175.14088 |
| 0.618 | 173.29586 |
| 0.786 | 170.22422 |
The current price appears to be within the 0.618 retracement level, suggesting a possible area of support. If the price holds above this level, it might indicate the continuation of the uptrend. However, if it breaks below, the next significant area could be the 0.786 level. These levels should be monitored closely as they might act as support or resistance areas.
Conclusion
CHFJPY demonstrates an intriguing upward trend with notable Fibonacci retracement levels providing critical insight. The current positioning at the 0.618 level provides a potential support zone, and traders should watch for the price reactions at this point. While an upward continuation could solidify the trend, breaches below key levels may pose risks and suggest a potential shift in momentum. Overall, understanding these dynamics is vital for informed trading decisions.
Smart Data Insight
Master the Perfect Entry & Exit for this Stock
Don't leave your profits to chance. Historically, this stock follows specific seasonal patterns that institutional traders use to maximize returns.
- ✅ Identify the "Golden Buying Window"
- ✅ Avoid high-risk correction cycles
- ✅ Backtested data from the last 20+ years