August 15, 2025 a 05:08 am
CHFJPY: Fibonacci Analysis
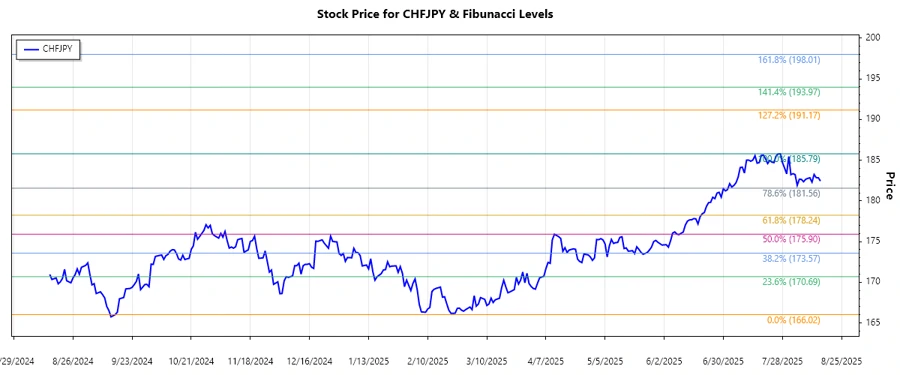
Over recent months, CHFJPY has demonstrated fluctuations that suggest varying investor sentiment and macroeconomic factors influencing its behavior. The data reflects a dominant upward trend in recent times, indicative of stronger performance of the Swiss Franc against the Japanese Yen. This dynamic is crucial for traders as it may affect positions in this currency pair.
Fibonacci Analysis
Based on the historical data analyzed, the CHFJPY has shown a notable upward trend from mid-March to mid-August 2025.
| Element | Details |
|---|---|
| Trend Start Date | 2025-03-16 |
| Trend End Date | 2025-08-15 |
| Highest Point | 185.789 on 2025-07-27 |
| Lowest Point | 166.01976 on 2024-09-15 |
| Fibonacci Levels: |
|
| Current Retracement Zone | 0.618 |
| Technical Interpretation | The current price is in the 0.618 retracement zone, indicating strong potential support. Traders may consider this a favorable entry point for long positions, expecting a bounce-back towards previous highs. |
Conclusion
The CHFJPY shows a robust uptrend, suggesting the increasing strength of the Swiss Franc against the Japanese Yen. The currency pair currently resides within a significant retracement zone at the 0.618 Fibonacci level, implying potential stability and support. This could present opportunities for traders looking for upward momentum continuity. However, as always, it's essential to consider broader market conditions and potential geopolitical or economic shifts that might impact future movements.
Smart Data Insight
Master the Perfect Entry & Exit for this Stock
Don't leave your profits to chance. Historically, this stock follows specific seasonal patterns that institutional traders use to maximize returns.
- ✅ Identify the "Golden Buying Window"
- ✅ Avoid high-risk correction cycles
- ✅ Backtested data from the last 20+ years