
May 28, 2026 a 01:00 pm
CHD: Fundamental Ratio Analysis - Church & Dwight Co., Inc.
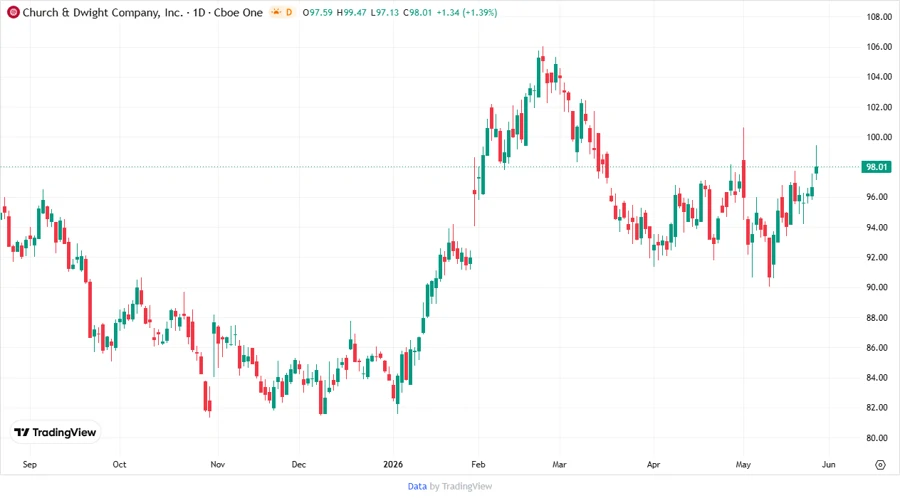
Church & Dwight Co., Inc. is a seasoned player in the consumer defensive sector, boasting robust brands like Arm & Hammer and Trojan. With a solid historical presence, its stock is a steady performer in the household and personal products industry. This analysis delves into its fundamental strengths and market positioning.
Fundamental Rating
Church & Dwight Co., Inc. exhibits a promising fundamental profile, with noteworthy scores in return metrics that bolster its market standing.
| Category | Score | Score Bar |
|---|---|---|
| Discounted Cash Flow (DCF) | 4 | |
| Return on Equity (ROE) | 4 | |
| Return on Assets (ROA) | 5 | |
| Debt to Equity | 2 | |
| Price to Earnings (P/E) | 2 | |
| Price to Book (P/B) | 1 |
Historical Rating
The historical fundamental scores provide insights into the company's stability and performance trends over time.
| Date | Overall | DCF | ROE | ROA | Debt to Equity | P/E | P/B |
|---|---|---|---|---|---|---|---|
| 2026-05-27 | 3 | 4 | 4 | 5 | 2 | 2 | 1 |
| N/A | 0 | 4 | 4 | 5 | 2 | 2 | 1 |
Analyst Price Targets
Analyst projections imply a cautiously optimistic future for Church & Dwight Co., Inc., with a focus on potential growth.
| High | Low | Median | Consensus |
|---|---|---|---|
| $114 | $91 | $103.5 | $103.8 (Buy) |
Analyst Sentiment
The analyst sentiment reflects a positive outlook, with a majority leaning towards buy recommendations.
| Recommendation | Count | Score Bar |
|---|---|---|
| Strong Buy | 0 | |
| Buy | 18 | |
| Hold | 15 | |
| Sell | 1 | |
| Strong Sell | 0 |
Conclusion
Church & Dwight Co., Inc. presents a robust opportunity for investors, characterized by strong brand presence and consistent performance metrics. Despite challenges such as debt ratios, the company's potential for stable returns and growth in provocative consumer segments is notable. Analysts maintain a favorable disposition, suggesting the stock is a reliable candidate for buy considerations. Investors should consider the historical stability and outlook while keeping an eye on market dynamics.
Smart Data Insight
Master the Perfect Entry & Exit for this Stock
Don't leave your profits to chance. Historically, this stock follows specific seasonal patterns that institutional traders use to maximize returns.
- ✅ Identify the "Golden Buying Window"
- ✅ Avoid high-risk correction cycles
- ✅ Backtested data from the last 20+ years