March 04, 2026 a 03:31 pm

CHD: Dividend Analysis - Church & Dwight Co., Inc.
Church & Dwight Co., Inc., with its robust dividend history and commitment to shareholder returns, continues to display a stable financial performance amidst a challenging market environment. Its strategic operational efficiency and prudent financial management make it a potential consideration for investors focusing on consistent dividend payouts.
📊 Overview
Church & Dwight is a strong player in the consumer goods sector, known for maintaining a consistent dividend history over 42 years. As of now, the dividend yield stands at an attractive 1.18%, with a current dividend per share of $1.18 USD and no recent cuts or suspensions.
| Category | Details |
|---|---|
| Sector | Consumer Goods |
| Dividend Yield | 1.18% |
| Current Dividend per Share | $1.18 |
| Dividend History | 42 years |
| Last Cut or Suspension | None |
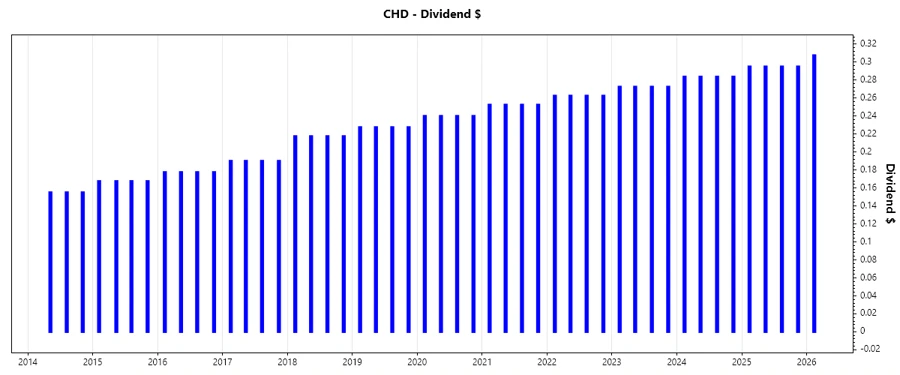
🗣️ Dividend History
The company's dividend history is a testament to its financial stability, with a track record of increasing dividends. This consistency is essential for income-focused investors seeking secure and growing dividends.
| Year | Dividend per Share (USD) |
|---|---|
| 2026 | 0.3075 |
| 2025 | 1.180 |
| 2024 | 1.1350 |
| 2023 | 1.0900 |
| 2022 | 1.0500 |
📈 Dividend Growth
Dividends have shown steady growth, with a 3-year growth rate of 3.97% and a 5-year growth rate of 4.21%. This growth underscores the company's capability to enhance shareholder value progressively.
| Time | Growth |
|---|---|
| 3 years | 3.97% |
| 5 years | 4.21% |
The average dividend growth is 4.21% over 5 years. This shows moderate but steady dividend growth.
💼 Payout Ratio
Payout ratios are vital in evaluating dividend sustainability. Church & Dwight's EPS-based payout ratio is at a conservative 38.34%, while the free cash flow-based payout is even lower at 26.00%, indicating a strong ability to maintain dividend payments.
| Key Figure | Ratio |
|---|---|
| EPS-based | 38.34% |
| Free cash flow-based | 26.00% |
The low payout ratios suggest that the company's dividends are well-covered, minimizing the risk of potential cuts.
🔍 Cashflow & Capital Efficiency
Cashflow and capital efficiency are crucial for long-term sustainability. The free cash flow yield and earnings yield indicate decent value, while the ratio of CAPEX to operating cash flow remains manageable, demonstrating efficient capital deployment.
| Year | 2023 | 2024 | 2025 |
|---|---|---|---|
| Free Cash Flow Yield | 3.49% | 3.78% | 5.37% |
| Earnings Yield | 3.26% | 2.26% | 3.62% |
| CAPEX to Operating Cash Flow | 21.69% | 15.55% | 10.07% |
| Stock-based Compensation to Revenue | 1.08% | 0.97% | 0.94% |
| Free Cash Flow / Operating Cash Flow Ratio | 78.31% | 84.45% | 89.93% |
The company's positive cash flow metrics ensure its potential to sustain and grow dividends.
🔄 Balance Sheet & Leverage Analysis
A strong balance sheet with moderate leverage is crucial for financial resilience. Church & Dwight's debt ratios indicate a balanced approach to leverage, with notable liquidity positions.
| Year | 2023 | 2024 | 2025 |
|---|---|---|---|
| Debt-to-Equity | 0.68 | 0.55 | 0.55 |
| Debt-to-Assets | 30.41% | 24.74% | 24.74% |
| Debt-to-Capital | 40.33% | 35.52% | 35.52% |
| Net Debt to EBITDA | 1.73 | 1.32 | 1.38 |
| Current Ratio | 1.08 | 1.70 | 1.07 |
| Quick Ratio | 0.64 | 1.24 | 0.71 |
| Financial Leverage | 2.22 | 2.03 | 2.23 |
The balance sheet metrics reflect a stable financial structure, enabling resilience during economic uncertainties.
📊 Fundamental Strength & Profitability
Strong returns on equity and assets highlight the company's ability to generate profits efficiently, while margins reflect its operational effectiveness.
| Year | 2023 | 2024 | 2025 |
|---|---|---|---|
| Return on Equity | 19.60% | 13.42% | 18.41% |
| Return on Assets | 8.82% | 6.59% | 8.27% |
| Net Profit Margin | 12.88% | 9.58% | 11.88% |
| EBIT Margin | 18.38% | 13.94% | 16.96% |
| EBITDA Margin | 22.21% | 17.85% | 20.95% |
| Gross Profit Margin | 44.11% | 45.69% | 44.73% |
| R&D to Revenue | 0.00% | 0.00% | 0.00% |
The profitability metrics confirm Church & Dwight's capability to generate robust returns and sustain its market position.
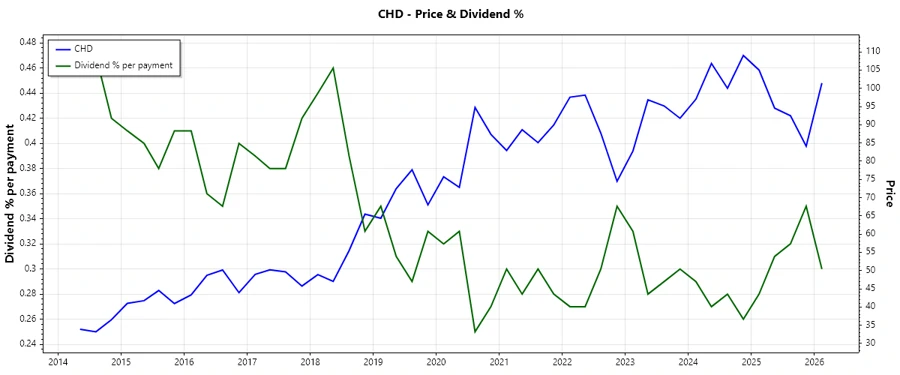
📉 Price Development
🔍 Dividend Scoring System
| Criterion | Score | Bar |
|---|---|---|
| Dividend Yield | 3 | |
| Dividend Stability | 5 | |
| Dividend Growth | 4 | |
| Payout Ratio | 4 | |
| Financial Stability | 5 | |
| Dividend Continuity | 5 | |
| Cashflow Coverage | 4 | |
| Balance Sheet Quality | 4 |
Total Score: 34 out of 40
✅ Rating
Church & Dwight Co., Inc. presents a reliable investment opportunity for dividend-focused investors. With a solid dividend history, healthy financial metrics, and stable growth, the company's shares are well-suited for those seeking stable income with potential for appreciation.
Smart Data Insight
Master the Perfect Entry & Exit for this Stock
Don't leave your profits to chance. Historically, this stock follows specific seasonal patterns that institutional traders use to maximize returns.
- ✅ Identify the "Golden Buying Window"
- ✅ Avoid high-risk correction cycles
- ✅ Backtested data from the last 20+ years