August 28, 2025 a 02:48 am


CHD: Dividend Analysis - Church & Dwight Co., Inc.
Church & Dwight Co., Inc., a robust player in the consumer goods sector, is a prominent dividend stock that has maintained a substantial dividend history over the decades. With its strong market capitalization and steady dividend growth, the company presents a compelling case for dividend investors. However, investors must closely examine key metrics such as the payout ratio and dividend yield in the context of the firm's overall financial health.
📊 Overview
Church & Dwight Co., Inc. operates within the Consumer Goods sector and offers investors a current dividend yield of 1.26%. With a current dividend per share of 1.12 USD and a continuous dividend history spanning 41 years, Church & Dwight showcases stability in its dividend offerings. Notably, the company has not experienced a dividend cut or suspension, highlighting its commitment to returning value to shareholders.
| Category | Detail |
|---|---|
| Sector | Consumer Goods |
| Dividend yield | 1.26% |
| Current dividend per share | 1.12 USD |
| Dividend history | 41 years |
| Last cut or suspension | None |
📉 Dividend History
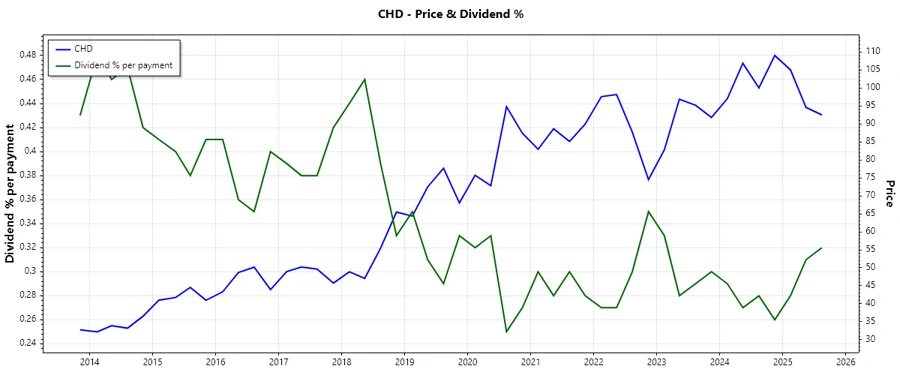
Church & Dwight has demonstrated a strong commitment to maintaining an uninterrupted dividend history. This consistency provides confidence to investors who prioritize income stability. The historical performance indicates a consistent increase in dividend payments, underlining the company's growth and shareholder return focus.
| Year | Dividend per Share (USD) |
|---|---|
| 2025 | 0.885 |
| 2024 | 1.135 |
| 2023 | 1.090 |
| 2022 | 1.050 |
| 2021 | 1.010 |
📈 Dividend Growth
Examining the dividend growth of Church & Dwight, it's evident that the company has managed moderate yet consistent dividend increases over the recent years, indicating financial resilience and strategic management. Such growth is critical for compensating inflation impacts and providing a real income increase for shareholders.
| Time | Growth |
|---|---|
| 3 years | 3.97% |
| 5 years | 4.52% |
The average dividend growth is 4.52% over 5 years. This shows moderate but steady dividend growth, reflecting the company's ability to balance reinvestment and shareholder returns.
✅ Payout Ratio
Payout ratios are crucial indicators of a company's dividend sustainability and financial health. They reflect the proportion of earnings paid out as dividends and highlight the room available for reinvestment into business operations.
| Key figure ratio | Percentage |
|---|---|
| EPS-based | 52.38% |
| Free cash flow-based | 29.37% |
The EPS payout ratio stands at 52.38%, which is within a sustainable range, suggesting that Church & Dwight effectively balances shareholder rewards with essential reinvestments. The FCF payout ratio of 29.37% signifies ample cash flow coverage, providing room for financial maneuverability.
⚠️ Cashflow & Capital Efficiency
Understanding cashflow and capital efficiency gives insights into a company's operational efficiency and long-term sustainability. High-quality cash flow, efficient capital allocation, and controlled financial leverage are veritable indicators of robust financial health.
| Year | 2024 | 2023 | 2022 |
|---|---|---|---|
| Free Cash Flow Yield | 3.78% | 3.49% | 3.61% |
| Earnings Yield | 2.26% | 3.26% | 2.11% |
| CAPEX to Operating Cash Flow | 15.55% | 21.69% | 20.20% |
| Stock-based Compensation to Revenue | 0.97% | 1.08% | 0.60% |
| Free Cash Flow / Operating Cash Flow Ratio | 84.45% | 78.31% | 79.80% |
The metrics underline a stable and effectively managed cashflow situation, maintaining a higher than average capital efficiency across the years. This substantiates Church & Dwight's ability to continue its dividend payments and strategic reinvestments efficiently.
💼 Balance Sheet & Leverage Analysis
An analysis of the balance sheet and leverage ratios provides insights into the company's solvency, liquidity, and financial stability. A sound balance sheet structure enhances a company's ability to weather economic downturns and pursue growth opportunities.
| Year | 2024 | 2023 | 2022 |
|---|---|---|---|
| Debt-to-Equity | 0.506 | 0.624 | 0.766 |
| Debt-to-Assets | 0.248 | 0.281 | 0.320 |
| Debt-to-Capital | 0.336 | 0.384 | 0.434 |
| Net Debt to EBITDA | 1.175 | 1.582 | 2.908 |
| Current Ratio | 1.702 | 1.076 | 1.179 |
| Quick Ratio | 1.237 | 0.644 | 0.633 |
| Financial Leverage | 2.037 | 2.223 | 2.391 |
The financial ratios illustrate solid leverage management with declining debt levels and improving liquidity ratios, reflecting positively on Church & Dwight's ability to manage its obligations and fortify its capital structure over time.
🗣️ Fundamental Strength & Profitability
Key profitability metrics such as ROE (Return on Equity) and ROA (Return on Assets) are vital for assessing a company's efficiency in generating profits relative to shareholder investments and its asset base, respectively.
| Year | 2024 | 2023 | 2022 |
|---|---|---|---|
| Return on Equity (ROE) | 13.42% | 19.60% | 11.86% |
| Return on Assets (ROA) | 6.59% | 8.82% | 4.96% |
| Net Margin | 9.58% | 12.88% | 7.70% |
| EBIT Margin | 13.94% | 18.38% | 11.40% |
| EBITDA Margin | 17.29% | 22.21% | 15.37% |
| Gross Margin | 45.69% | 44.11% | 41.86% |
| R&D to Revenue | 2.29% | 2.09% | 2.05% |
The consistency in high profit margins and return ratios underscores Church & Dwight's operational effectiveness and managerial competence. This high level of profitability augments its capacity to reward shareholders continually.
📊 Price Development
✅ Dividend Scoring System
A comprehensive scoring system individually evaluates the principal dividend metrics, thus providing a holistic view of Church & Dwight's merit as a dividend stock.
| Category | Score | Indicator |
|---|---|---|
| Dividend yield | 3/5 | |
| Dividend Stability | 5/5 | |
| Dividend growth | 3/5 | |
| Payout ratio | 4/5 | |
| Financial stability | 4/5 | |
| Dividend continuity | 5/5 | |
| Cashflow Coverage | 4/5 | |
| Balance Sheet Quality | 4/5 |
Overall Score: 32/40
🗣️ Rating
Church & Dwight Co., Inc. exhibits a commendable dividend profile characterized by a stable payout history, moderate growth, and a disciplined financial strategy. Rated positively, this stock is a suitable choice for investors aiming for a balanced portfolio with reliable income and moderate growth potential.
Smart Data Insight
Master the Perfect Entry & Exit for this Stock
Don't leave your profits to chance. Historically, this stock follows specific seasonal patterns that institutional traders use to maximize returns.
- ✅ Identify the "Golden Buying Window"
- ✅ Avoid high-risk correction cycles
- ✅ Backtested data from the last 20+ years