
June 20, 2026 a 04:03 am

CFG: Trend and Support & Resistance Analysis - Citizens Financial Group, Inc.
The CFG stock has shown notable movements over the past months. Recently, there has been an upward trend, indicating potential growth opportunities for investors. However, attention should be given to the support and resistance zones to identify critical entry and exit points. Investors should be aware of market volatility and corporate strategies to mitigate potential risks.
Trend Analysis
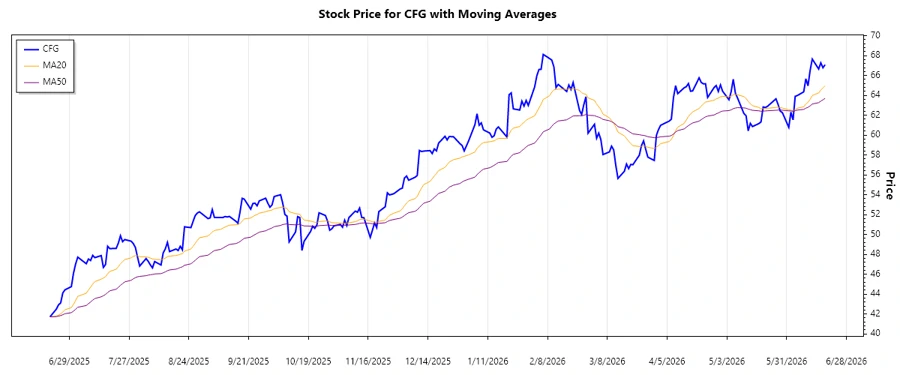
The analysis over the last several months shows a clear upward trend, particularly in the most recent data. By calculating the EMA20 and EMA50, we can see distinct price momentum.
| Date | Closing Price | Trend |
|---|---|---|
| 2026-06-18 | 67.08 | ▲ Upward |
| 2026-06-17 | 66.78 | ▲ Upward |
| 2026-06-16 | 67.27 | ▲ Upward |
| 2026-06-15 | 66.65 | ▲ Upward |
| 2026-06-12 | 67.65 | ▲ Upward |
| 2026-06-11 | 66.51 | ▲ Upward |
| 2026-06-10 | 64.96 | ▲ Upward |
The consistent position of EMA20 above EMA50 confirms a sustained bullish trend.
Support- and Resistance
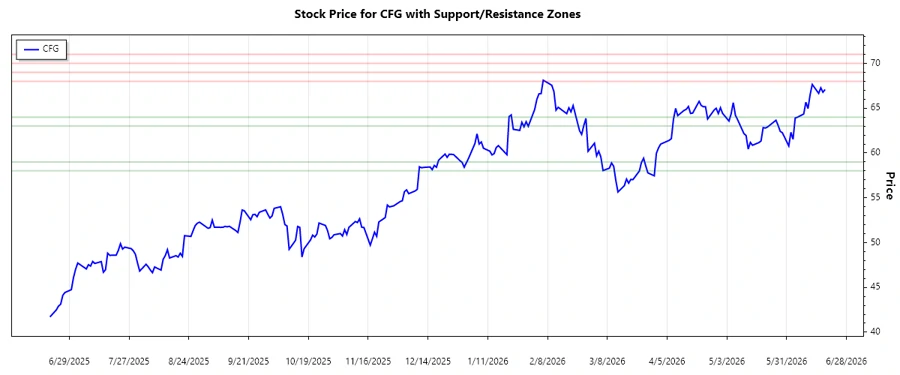
Through analysis, the following support and resistance zones were identified:
| Zone Type | From | To |
|---|---|---|
| Support | 63.00 | 64.00 |
| Support | 58.00 | 59.00 |
| Resistance | 68.00 | 69.00 |
| Resistance | 70.00 | 71.00 |
The current stock price is within a higher support zone, suggesting a possible pullback in the short term before further upward movements.
Conclusion
CFG's stock is currently in an upward trajectory, presenting potential opportunities for growth-seeking investors. However, the observed resistance levels may offer some challenges in sustaining momentum without substantial volume or market catalysts. Risk-averse investors should mind the support zones that might provide suitable entry points. Overall, CFG's current operational strength appears to align well with the broader financial market dynamics, though constant monitoring for economic or industry-specific changes remains crucial.
Smart Data Insight
Master the Perfect Entry & Exit for this Stock
Don't leave your profits to chance. Historically, this stock follows specific seasonal patterns that institutional traders use to maximize returns.
- ✅ Identify the "Golden Buying Window"
- ✅ Avoid high-risk correction cycles
- ✅ Backtested data from the last 20+ years