June 16, 2026 a 11:44 am

CFG: Fibonacci Analysis - Citizens Financial Group, Inc.
Citizens Financial Group, Inc. has shown significant resilience in the face of market fluctuations, demonstrating a strong upward trend in recent months. This upward momentum is supported by robust performance across its Consumer and Commercial Banking divisions. Given the current levels, investors might find potential buying opportunities, particularly if retracement levels provide strong support. However, market participants should remain cautious of broader economic factors that could impact the banking sector.
Fibonacci Analysis
| Key Metrics | Details |
|---|---|
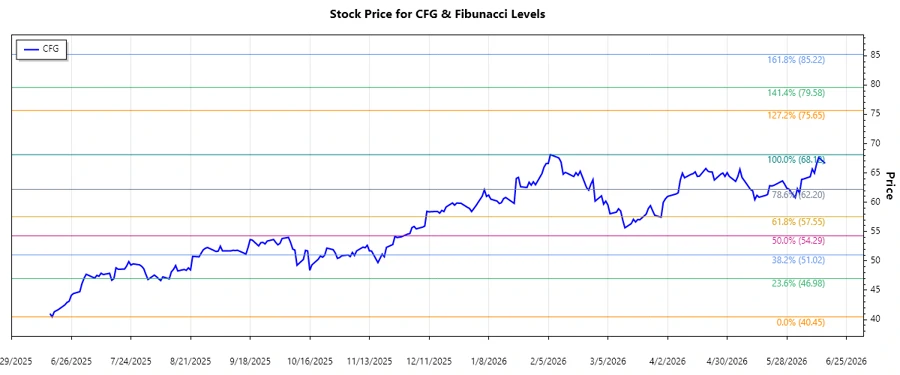
| Trended Period | March 16, 2025 - June 15, 2026 |
| High Point | $68.12 on June 06, 2026 |
| Low Point | $40.45 on June 17, 2025 |
| Fibonacci 0.236 Level | $54.04 |
| Fibonacci 0.382 Level | $57.80 |
| Fibonacci 0.5 Level | $60.59 |
| Fibonacci 0.618 Level | $63.38 |
| Fibonacci 0.786 Level | $67.64 |
| Current Price Zone | 0.618 Retracement Level |
| Technical Interpretation | The current price in the 0.618 retracement level suggests significant support, potentially indicating a bullish continuation from this level. |
Conclusion
In conclusion, the upward trend observed in Citizens Financial Group, Inc. underscores its robust operational performance. The current position around the 0.618 Fibonacci retracement level can offer strong support, demonstrating resilience against market volatility. While the technical indicators suggest bullish momentum, market participants should remain vigilant of potential market shifts that could affect the financial sector. Given CFG's broad exposure to various banking services, it remains well-positioned to capitalize on sector growth, though risks associated with macroeconomic factors should not be overlooked.
Smart Data Insight
Master the Perfect Entry & Exit for this Stock
Don't leave your profits to chance. Historically, this stock follows specific seasonal patterns that institutional traders use to maximize returns.
- ✅ Identify the "Golden Buying Window"
- ✅ Avoid high-risk correction cycles
- ✅ Backtested data from the last 20+ years