May 19, 2026 a 03:15 pm
CFG: Fibonacci Analysis - Citizens Financial Group, Inc.
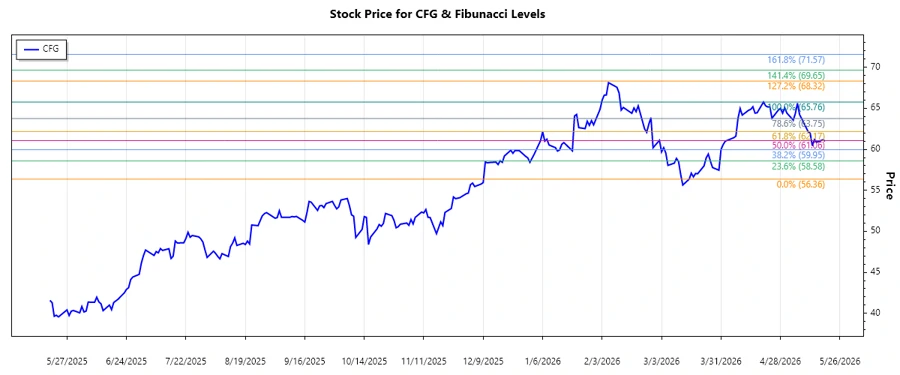
The Citizens Financial Group, Inc. stock has shown noticeable volatility over the past few months. The stock experienced a strong upward trend recently, demonstrating resilience amid market fluctuations. As a major player in the banking industry, CFG continues to draw investor interest, fueled by consistent performance across its consumer and commercial banking segments. Investors are closely monitoring technical indicators such as the Fibonacci retracement levels to forecast potential support and resistance zones in this dynamic market.
Fibonacci Analysis
| Aspect | Details |
|---|---|
| Start Date of Trend | 2026-03-18 |
| End Date of Trend | 2026-05-06 |
| High Point | $65.76 on 2026-04-20 |
| Low Point | $56.36 on 2026-03-16 |
| Fibonacci Level 0.236 | $58.81 |
| Fibonacci Level 0.382 | $60.49 |
| Fibonacci Level 0.5 | $61.55 |
| Fibonacci Level 0.618 | $62.61 |
| Fibonacci Level 0.786 | $64.09 |
| Current Retracement Zone | 0.0 - 0.236 |
| Technical Interpretation | The current price is close to breaking through support at the 0.236 retracement level, which could indicate potential for further consolidation. |
Conclusion
The Citizens Financial Group, Inc. has shown a strong recovery from its lows earlier this year, with a resilient upward trend that marks significant investor optimism. However, the current price is hovering near critical Fibonacci retracement levels which may signal either a continuation of the bullish trend or a reversal. Investors should watch closely to determine whether CFG can maintain support above these levels or if profit-taking might lead to a downturn. The key lies in observing market sentiment and adjusting strategies accordingly. The bank's strong fundamentals nevertheless provide an underlying safety net that could attract long-term investors.
Smart Data Insight
Master the Perfect Entry & Exit for this Stock
Don't leave your profits to chance. Historically, this stock follows specific seasonal patterns that institutional traders use to maximize returns.
- ✅ Identify the "Golden Buying Window"
- ✅ Avoid high-risk correction cycles
- ✅ Backtested data from the last 20+ years