May 25, 2025 a 05:15 am
CFG: Fibonacci Analysis - Citizens Financial Group, Inc.
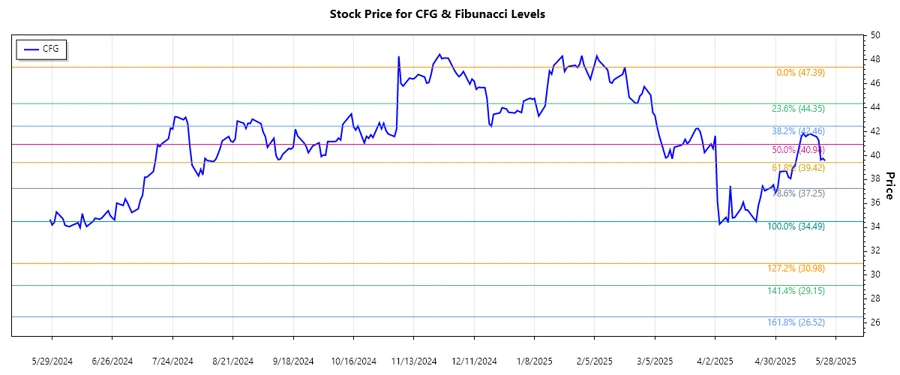
The Citizens Financial Group stock has demonstrated significant price volatility in recent months. Starting from an impressive high, the stock has recently experienced a noteworthy decline. While the stock's broader market position remains strong due to diverse banking operations, potential investors should be cautious of the current downtrend. Technical indicators could signal upcoming resistance levels, affecting short-term trading strategies.
Fibonacci Analysis
| Detail | Value |
|---|---|
| Trend Start Date | 2025-02-19 |
| Trend End Date | 2025-05-23 |
| High Price | $47.39 (2025-02-19) |
| Low Price | $34.49 (2025-04-21) |
| Fibonacci Level 0.236 | $37.56 |
| Fibonacci Level 0.382 | $39.59 |
| Fibonacci Level 0.5 | $40.94 |
| Fibonacci Level 0.618 | $42.30 |
| Fibonacci Level 0.786 | $44.22 |
| Current Retracement Zone | 0.382 |
| Technical Interpretation | The stock is currently trading around the 0.382 Fibonacci retracement area, indicating potential resistance. Traders should watch for price action and volume around this level for further insights. |
Conclusion
The technical analysis of Citizens Financial Group signals a recent downward trend that traders should heed. The current price suggests a potential pause in the downtrend near the 0.382 Fibonacci level, which could act as a resistance point. The broader market support for Citizens, coupled with its diversified banking operations, offers a cushion against adverse price movements. However, investors should be vigilant about global economic conditions and regulatory changes that can impact the financial sector. While the long-term outlook remains positive due to fundamental strengths, short-term volatility can be anticipated, necessitating strategic position adjustments. Financial analysts should incorporate these technical insights into their evaluations to inform sound investment decisions.
Smart Data Insight
Master the Perfect Entry & Exit for this Stock
Don't leave your profits to chance. Historically, this stock follows specific seasonal patterns that institutional traders use to maximize returns.
- ✅ Identify the "Golden Buying Window"
- ✅ Avoid high-risk correction cycles
- ✅ Backtested data from the last 20+ years