
July 14, 2026 a 03:30 am

CFG: Dividend Analysis - Citizens Financial Group, Inc.
Citizens Financial Group presents a solid dividend profile with a modest yield of 2.77% and consistent payouts over 13 years. With a reasonable payout ratio based on both EPS and free cash flow, CFG maintains a sustainable dividend policy. This potential makes CFG attractive for dividend investors seeking stability and growth.
📊 Overview
This section provides a snapshot of CFG's core dividend statistics, highlighting their sector position and key dividend metrics.
| Aspect | Details |
|---|---|
| Sector | Financial Services |
| Dividend Yield | 2.77 % |
| Current Dividend Per Share | 2.06 USD |
| Dividend History | 13 years |
| Last Cut or Suspension | None |
🗣️ Dividend History
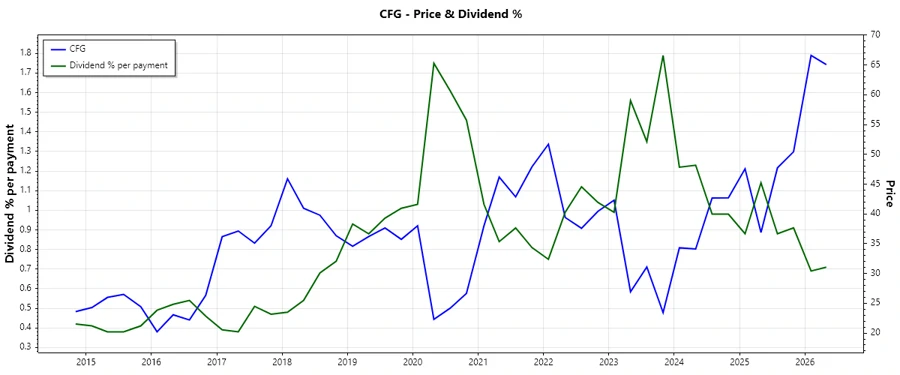
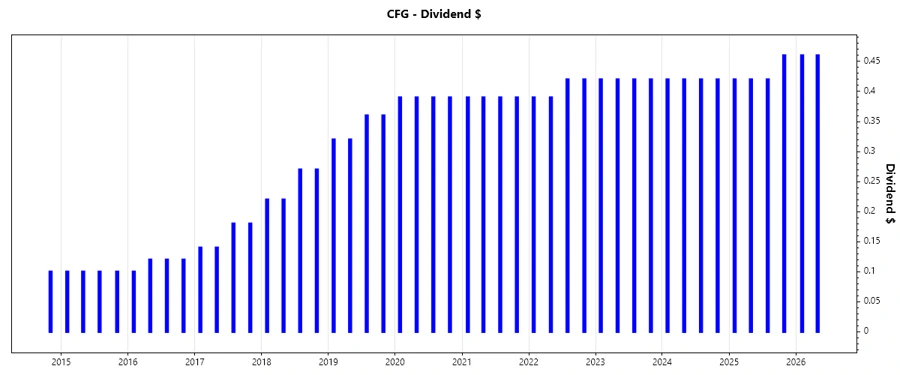
CFG has demonstrated strong dividend continuity over the years, reflecting its resilience and commitment to returning value to shareholders. Analyzing this trend helps investors understand the company's stability, especially in times of economic uncertainty.
| Year | Dividend Per Share |
|---|---|
| 2026 | 0.92 |
| 2025 | 1.72 |
| 2024 | 1.68 |
| 2023 | 1.68 |
| 2022 | 1.62 |
📈 Dividend Growth
The growth rate of dividends is crucial as it signals a company's potential in increasing shareholder returns over time. CFG's dividend growth demonstrates their ability to reinvest and expand.
| Time | Growth |
|---|---|
| 3 years | 2.02 % |
| 5 years | 1.97 % |
The average dividend growth is 1.97 % over 5 years. This shows moderate but steady dividend growth.
✅ Payout Ratio
Payout ratios indicate how well earnings support dividends. CFG's ratios suggest a balance between rewarding shareholders and retaining earnings for growth.
| Key Figure | Ratio |
|---|---|
| EPS-based | 44.33 % |
| Free cash flow-based | 34.81 % |
Both EPS-based (44.33%) and FCF-based (34.81%) payout ratios illustrate a conservative approach, indicating sufficient earnings coverage for dividends.
📊 Cashflow & Capital Efficiency
Cashflow and capital efficiency metrics are critical in understanding a company's operational efficiency and ability to support dividend payments through cash flow.
| Metric | 2025 | 2024 | 2023 |
|---|---|---|---|
| Free Cash Flow Yield | 8.08 % | 9.53 % | 17.71 % |
| Earnings Yield | 7.27 % | 7.65 % | 10.21 % |
| CAPEX to Operating Cash Flow | 7.87 % | 6.10 % | 5.81 % |
| Stock-based Compensation to Revenue | 1.08 % | 0.79 % | 0.71 % |
| Free Cash Flow / Operating Cash Flow Ratio | 92.13 % | 93.90 % | 94.19 % |
CFG exhibits robust free cash flow generation, supporting its dividend consistency and providing flexibility for capital investments.
📉 Balance Sheet & Leverage Analysis
A company's balance sheet health is vital for assessing its ability to sustain dividend payments and manage financial obligations under varied market conditions.
| Metric | 2025 | 2024 | 2023 |
|---|---|---|---|
| Debt-to-Equity | 42.87 % | 51.13 % | 57.40 % |
| Debt-to-Assets | 4.98 % | 5.70 % | 6.29 % |
| Debt-to-Capital | 30.01 % | 33.83 % | 36.47 % |
| Net Debt to EBITDA | -0.54 | 0.49 | 0.77 |
| Current Ratio | 1.04 | 0.25 | 0.24 |
| Quick Ratio | 1.04 | 0.25 | 0.24 |
| Financial Leverage | 8.60 | 8.97 | 9.12 |
CFG demonstrates cautious financial management with manageable leverage levels, supporting financial resilience and dividend reliability.
📊 Fundamental Strength & Profitability
The company's profitability metrics provide insight into its operational efficiency and capability to generate returns and support dividends.
| Metric | 2025 | 2024 | 2023 |
|---|---|---|---|
| Return on Equity | 6.96 % | 6.22 % | 6.61 % |
| Return on Assets | 0.81 % | 0.69 % | 0.72 % |
| Net Margin | 16.42 % | 12.22 % | 13.19 % |
| EBIT Margin | 20.88 % | 15.29 % | 16.66 % |
| EBITDA Margin | 24.17 % | 19.32 % | 20.58 % |
| Gross Margin | 69.75 % | 57.56 % | 61.84 % |
| Research & Development to Revenue | 0 % | 0 % | 0 % |
CFG's profitability indices consistently reflect its robustness in generating income, suggesting a solid foundation for enduring dividends.
📊 Price Development
🗳️ Dividend Scoring System
The dividend scoring system evaluates CFG's dividend safety and growth potential based on various criteria.
| Criterion | Score | Score Bar |
|---|---|---|
| Dividend yield | 4 | |
| Dividend Stability | 5 | |
| Dividend growth | 3 | |
| Payout ratio | 4 | |
| Financial stability | 4 | |
| Dividend continuity | 5 | |
| Cashflow Coverage | 4 | |
| Balance Sheet Quality | 4 |
Total Score: 33/40
✅ Rating
CFG is a sturdy dividend payer with a promising yield and a historic record of stable payments. It is rated "BUY" for dividend investors seeking a stable income stream combined with modest growth potential. The company's financial discipline and dividend consistency make it an attractive buy within the financial services sector.
Smart Data Insight
Master the Perfect Entry & Exit for this Stock
Don't leave your profits to chance. Historically, this stock follows specific seasonal patterns that institutional traders use to maximize returns.
- ✅ Identify the "Golden Buying Window"
- ✅ Avoid high-risk correction cycles
- ✅ Backtested data from the last 20+ years