
June 03, 2026 a 03:30 pm

CFG: Dividend Analysis - Citizens Financial Group, Inc.
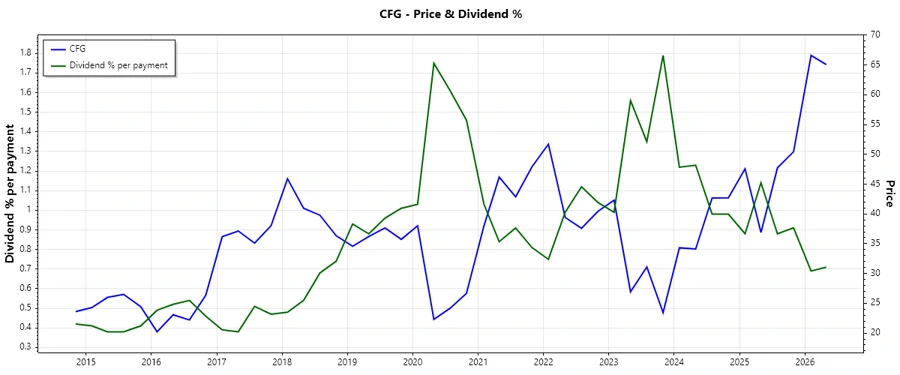
Citizens Financial Group, Inc. demonstrates a stable dividend profile with a consistent history of payouts. The company offers a solid dividend yield, which is attractive to income-focused investors. Despite modest growth, the reliability of payments enhances its reputation among long-term shareholders.
📊 Overview
The following table provides a snapshot of CFG's dividend-related metrics.
| Metric | Value |
|---|---|
| Sector | Finance |
| Dividend Yield | 2.77 % |
| Current Dividend per Share | 2.06 USD |
| Dividend History | 13 years |
| Last Cut or Suspension | None |
🗣️ Dividend History
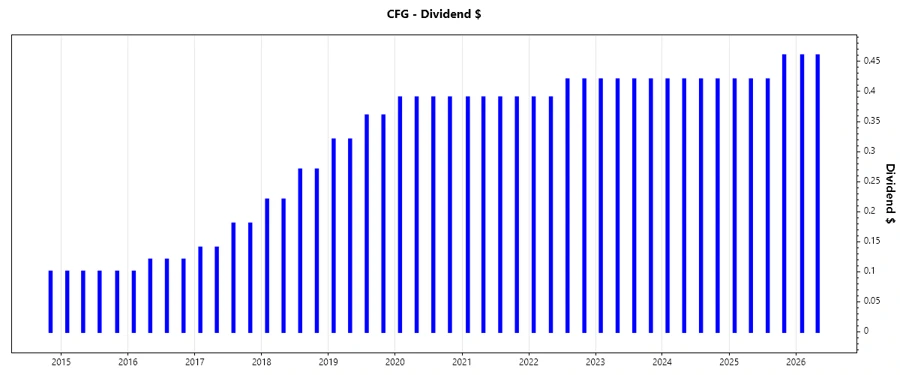
CFG's dividend history reflects reliability with steady payouts, crucial for evaluating its attractiveness as a dividend investment.
| Year | Dividend per Share (USD) |
|---|---|
| 2026 | 0.92 |
| 2025 | 1.72 |
| 2024 | 1.68 |
| 2023 | 1.68 |
| 2022 | 1.62 |
📈 Dividend Growth
The growth in CFG's dividends indicates a steady increase, integral for understanding future income potential.
| Time | Growth |
|---|---|
| 3 years | 2.02 % |
| 5 years | 1.97 % |
The average dividend growth is 1.97 % over 5 years. This shows moderate but steady dividend growth.
✅ Payout Ratio
An insightful measure of dividend sustainability through key payout ratios based on earnings and cash flow.
| Key figure | Ratio |
|---|---|
| EPS-based | 44.33 % |
| Free cash flow-based | 34.81 % |
The EPS Payout Ratio of 44.33 % and the FCF Payout Ratio of 34.81 % suggest a healthy cushion for CFG to balance dividend distributions with retained earnings.
💰 Cashflow & Capital Efficiency
Evaluates CFG's capacity to generate cash flow and invest capital effectively to support dividend policies.
| Metric | 2023 | 2024 | 2025 |
|---|---|---|---|
| Free Cash Flow Yield | 17.71 % | 9.53 % | 8.08 % |
| Earnings Yield | 10.21 % | 7.65 % | 7.27 % |
| Capex to Operating Cash Flow | 5.81 % | 6.10 % | 7.87 % |
| Stock Compensation to Revenue | 0.71 % | 0.79 % | 1.08 % |
| Free Cash Flow / Operating Cash Flow Ratio | 94.19 % | 93.90 % | 92.13 % |
CFG's steadiness in free cash flow and efficiency in its capital expenditure underpin its dividend-paying capacity.
📉 Balance Sheet & Leverage Analysis
Examines CFG's debt management and balance sheet health ensuring robust financial positioning.
| Metric | 2023 | 2024 | 2025 |
|---|---|---|---|
| Debt-to-Equity | 57.40 % | 51.13 % | 42.87 % |
| Debt-to-Assets | 6.29 % | 5.70 % | 4.98 % |
| Debt-to-Capital | 36.47 % | 33.83 % | 30.01 % |
| Net Debt to EBITDA | 0.773 | 0.488 | -0.536 |
| Current Ratio | 0.24 | 0.25 | 1.04 |
| Quick Ratio | 0.24 | 0.25 | 1.04 |
| Financial Leverage | 9.12 | 8.97 | 8.60 |
CFG's meticulous leverage management is indicative of its commitment to a resilient balance sheet.
📈 Fundamental Strength & Profitability
Analyzes profitability ratios showcasing CFG's capacity to generate returns from its business operations.
| Metric | 2023 | 2024 | 2025 |
|---|---|---|---|
| Return on Equity | 6.61 % | 6.22 % | 6.96 % |
| Return on Assets | 0.72 % | 0.69 % | 0.81 % |
| Net Margin | 13.19 % | 12.22 % | 16.42 % |
| EBIT Margin | 16.66 % | 15.29 % | 20.89 % |
| EBITDA Margin | 20.58 % | 19.32 % | 24.17 % |
| Gross Margin | 61.84 % | 57.56 % | 69.75 % |
| R&D to Revenue | 0 % | 0 % | 0 % |
CFG exhibits strong profitability with consistent margins, underscoring its operational efficiency.
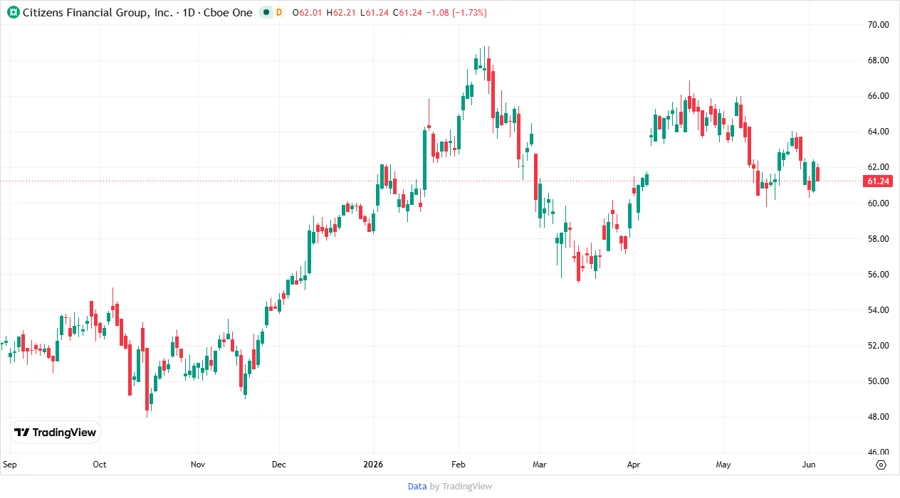
📉 Price Development
🗣️ Dividend Scoring System
| Category | Score | Visualization |
|---|---|---|
| Dividend Yield | 3 | |
| Dividend Stability | 4 | |
| Dividend Growth | 3 | |
| Payout Ratio | 4 | |
| Financial Stability | 4 | |
| Dividend Continuity | 5 | |
| Cashflow Coverage | 4 | |
| Balance Sheet Quality | 4 |
Overall Score: 31/40
🗣️ Rating
CFG presents itself as a reliable dividend stock with sound financial health and consistent payouts. It is suitable for investors seeking stable income, albeit with moderate growth prospects. Consideration should be given to the relatively modest yield compared to higher-yielding alternatives in the sector.
Smart Data Insight
Master the Perfect Entry & Exit for this Stock
Don't leave your profits to chance. Historically, this stock follows specific seasonal patterns that institutional traders use to maximize returns.
- ✅ Identify the "Golden Buying Window"
- ✅ Avoid high-risk correction cycles
- ✅ Backtested data from the last 20+ years