May 01, 2026 a 07:46 am

CFG: Dividend Analysis - Citizens Financial Group, Inc.
Citizens Financial Group, Inc. shows a strong historical commitment to dividends, with 13 years of continuous payments. Despite moderate yields, the company's ability to sustain and slightly grow its dividends makes it an attractive option for income-focused investors seeking stability. Understanding its dividend profile and financial health is paramount for making informed investment decisions.
📊 Overview
Citizens Financial Group operates within the financial sector and offers a dividend yield of approximately 2.77%. With a current dividend per share of 2.06 USD, the stock presents a viable option for dividend-seeking investors. The company has a commendable 13-year track record of dividend payments, with no recent cuts or suspensions, underscoring its commitment to shareholder returns.
| Sector | Dividend Yield | Current DPS | Dividend History | Last Cut/Suspension |
|---|---|---|---|---|
| Financial | 2.77% | 2.06 USD | 13 years | None |
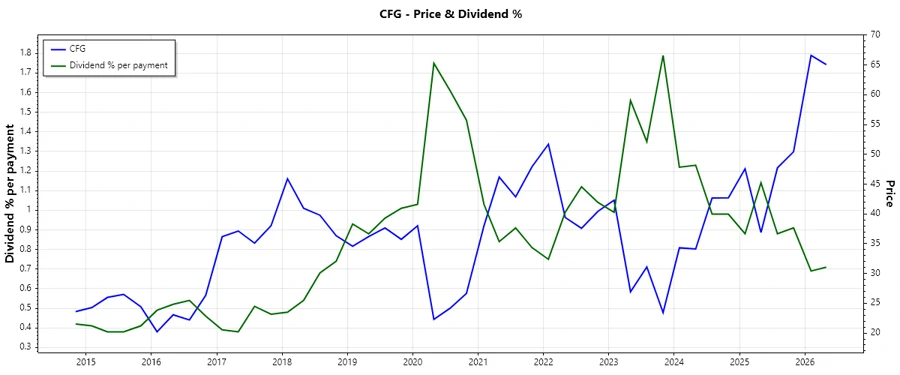
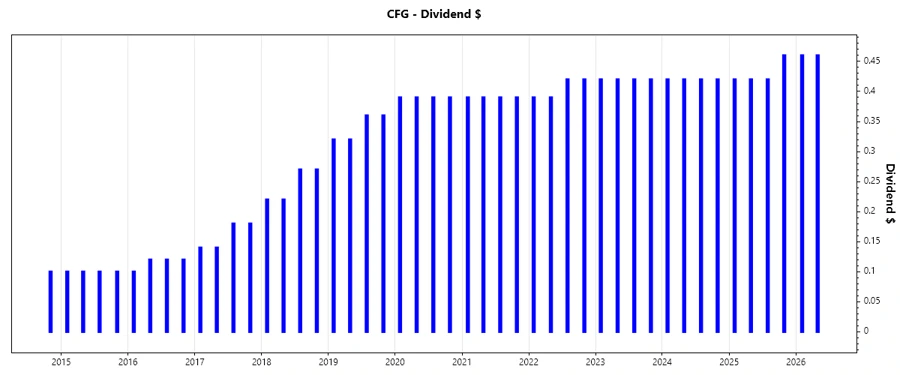
📈 Dividend History
Citizens Financial Group has demonstrated a steady approach to dividend distributions, highlighted by consistent annual payments over the past decade. Sustained dividend history signals financial robustness and management's dedication to rewarding shareholders.
| Year | Dividend Per Share (USD) |
|---|---|
| 2026 | 0.92 |
| 2025 | 1.72 |
| 2024 | 1.68 |
| 2023 | 1.68 |
| 2022 | 1.62 |
📈 Dividend Growth
The dividend growth rate indicates the pace at which a company's dividend payments have increased over time. Understanding these growth rates helps investors assess the potential for income generation.
| Time | Growth |
|---|---|
| 3 years | 2.02% |
| 5 years | 1.97% |
The average dividend growth is 1.97% over 5 years. This shows moderate but steady dividend growth, which might appeal to investors valuing consistent dividends over rapid but volatile increases.
💹 Payout Ratio
The payout ratio gives insight into what portion of earnings and free cash flow is being returned to shareholders as dividends. Evaluating these figures helps understand the sustainability of dividend payments.
| Key Figure | Ratio |
|---|---|
| EPS-based | 44.33% |
| Free cash flow-based | 42.95% |
The EPS-based payout ratio of 44.33% and the slightly lower free cash flow-based payout ratio of 42.95% suggest that CFG is maintaining a healthy balance in dividend distributions, neither overexerting earnings nor free cash reserves.
💸 Cashflow & Capital Efficiency
Robust cash flow and capital efficiency are vital for meeting ongoing dividend commitments and funding operational growth. The following metrics illustrate CFG's proficiency in these areas.
| Metric | 2025 | 2024 | 2023 |
|---|---|---|---|
| Free Cash Flow Yield | 8.08% | 9.53% | 17.71% |
| Earnings Yield | 7.27% | 7.65% | 10.21% |
| CAPEX/OCF | 7.87% | 6.10% | 5.81% |
| Stock-based Compensation/Revenue | 1.08% | 0.79% | 0.71% |
| FCF/OCF Ratio | 92.13% | 93.90% | 94.19% |
With high free cash flow yields and a steady earnings yield, CFG demonstrates efficient capital management, enabling sustainable dividend payments and reinvestment into the business.
🗒️ Balance Sheet & Leverage Analysis
A thorough examination of balance sheet ratios sheds light on CFG's leverage and financial health, crucial for risk assessment in dividend stocks.
| Metric | 2025 | 2024 | 2023 |
|---|---|---|---|
| Debt-to-Equity | 42.87% | 51.13% | 57.40% |
| Debt-to-Assets | 4.98% | 5.70% | 6.29% |
| Debt-to-Capital | 30.01% | 33.83% | 36.47% |
| Net Debt to EBITDA | -0.54 | 0.49 | 0.77 |
| Current Ratio | 104.34 | 25.39% | 24.09% |
| Quick Ratio | 104.34 | 25.39% | 24.09% |
| Financial Leverage | 8.60 | 8.97 | 9.12 |
CFG maintains moderate leverage with improving liquidity ratios, implying solid financial stability crucial for sustaining dividends through economic cycles.
✅ Fundamental Strength & Profitability
Profitability indicators reflect CFG's ability to generate profits relative to revenue and assets. They underscore the company's operational efficiency and its capacity to provide competitive returns.
| Metric | 2025 | 2024 | 2023 |
|---|---|---|---|
| Return on Equity | 6.96% | 6.22% | 6.61% |
| Return on Assets | 0.81% | 0.69% | 0.72% |
| Margins (Net) | 16.42% | 12.22% | 13.19% |
| Margins (EBIT) | 20.88% | 15.29% | 16.66% |
| Margins (EBITDA) | 24.17% | 19.32% | 20.58% |
| Margins (Gross) | 69.75% | 57.56% | 61.84% |
| R&D/Revenue | 0% | 0% | 0% |
With consistent returns and robust margins, CFG's profit generation capability ensures a strong foundation for its dividend policy, enabling it to weather financial challenges effectively.
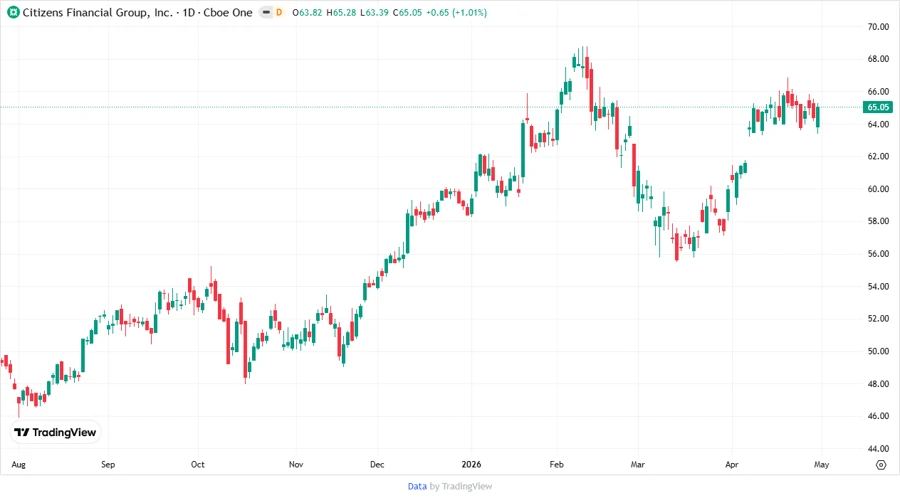
📉 Price Development
📊 Dividend Scoring System
| Category | Score | |
|---|---|---|
| Dividend yield | 3 | |
| Dividend Stability | 4 | |
| Dividend growth | 3 | |
| Payout ratio | 4 | |
| Financial stability | 4 | |
| Dividend continuity | 5 | |
| Cashflow Coverage | 4 | |
| Balance Sheet Quality | 4 |
Total Score: 31/40
✅ Rating
Citizens Financial Group, Inc. achieves a strong dividend score due to its consistent history, moderate yield, and prudent financial management. Investors seeking stability and gradual income growth may find CFG an attractive addition to their income portfolios.