February 08, 2026 a 11:31 am

CFG: Dividend Analysis - Citizens Financial Group, Inc.
Citizens Financial Group, Inc. (CFG) presents a compelling dividend profile with a stable yield and a consistent history of distributions. The bank's conservative payout ratios combined with moderate growth rates indicate potential for continued shareholder returns. Despite macroeconomic uncertainties, CFG maintains fiscal responsibility and a resilient financial structure.
📊 Overview
Citizens Financial Group operates within the Financial sector, showcasing a robust dividend yield of 2.64%. With a current dividend per share of $1.72, the company has demonstrated a commitment to dividend stability over 13 consecutive years without any cuts or suspensions.
| Metric | Value |
|---|---|
| Sector | Financial |
| Dividend yield | 2.64% |
| Current dividend per share | $1.72 |
| Dividend history | 13 years |
| Last cut or suspension | None |
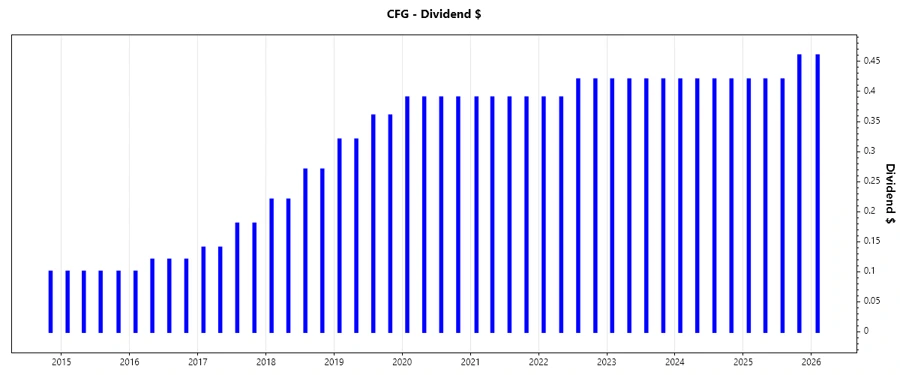
🗣️ Dividend History
Citizens Financial Group's dividend history underscores its commitment to returning capital to shareholders. This consistency builds investor confidence and implies stability, making CFG a suitable option for income-focused investors.
| Year | Dividend per Share (USD) |
|---|---|
| 2026 | 0.46 |
| 2025 | 1.72 |
| 2024 | 1.68 |
| 2023 | 1.68 |
| 2022 | 1.62 |
📈 Dividend Growth
Evaluating CFG’s dividend growth reveals a modest expansion, with a 3-year growth rate at 2.02% and a 5-year growth rate at 1.97%. These figures suggest a steady, albeit slow, enhancement in dividend payouts, appealing for long-term investors.
| Time | Growth |
|---|---|
| 3 years | 2.02% |
| 5 years | 1.97% |
The average dividend growth is 1.97% over 5 years. This demonstrates moderate but steady dividend growth.
⚠️ Payout Ratio
The payout ratio is a crucial indicator of dividend sustainability. CFG’s EPS-based payout ratio stands at 40.52%, and its FCF-based ratio is at 27.14%. These conservative ratios suggest that the company's dividends are well-covered by its earnings and free cash flow, signaling low risk of a dividend cut.
| Key figure | Ratio |
|---|---|
| EPS-based | 40.52% |
| Free cash flow-based | 27.14% |
These payout ratios indicate a prudent dividend distribution strategy, providing CFG with flexibility to manage future financial obligations.
✅ Cashflow & Capital Efficiency
Cash flow stability and capital efficiency are paramount for continued dividend payments. CFG maintains a robust free cash flow yield of 9.30% and an earnings yield of 6.23% for the latest period, indicating strong cash generation capability.
| Key Metric | 2025 | 2024 | 2023 |
|---|---|---|---|
| Free Cash Flow Yield | 0% | 9.53% | 17.71% |
| Earnings Yield | 7.27% | 7.65% | 10.21% |
| CAPEX to Operating Cash Flow | 0% | 6.10% | 5.81% |
| Stock-based Compensation to Revenue | 0% | 0.79% | 0.71% |
| Free Cash Flow / Operating Cash Flow Ratio | 0% | 0.94 | 0.94 |
The figures reflect CFG’s strong cash flow management, fostering confidence in its ability to sustain dividends and support growth initiatives.
📉 Balance Sheet & Leverage Analysis
A well-managed balance sheet with prudent leverage is crucial for long-term resilience. CFG displays stable leverage ratios, backed by a financial leverage ratio of 8.60.
| Key Metric | 2025 | 2024 | 2023 |
|---|---|---|---|
| Debt-to-Equity | 0.43 | 0.51 | 0.57 |
| Debt-to-Assets | 0.05 | 0.06 | 0.06 |
| Debt-to-Capital | 0.30 | 0.34 | 0.36 |
| Net Debt to EBITDA | -0.54 | 0.49 | 0.77 |
| Current Ratio | 1.04 | 0.25 | 0.24 |
| Quick Ratio | 1.04 | 0.25 | 0.24 |
| Financial Leverage | 8.60 | 8.97 | 9.12 |
Overall, CFG’s leverage metrics are indicative of a balanced approach to debt management, enhancing its capability to weather financial market fluctuations.
🗣️ Fundamental Strength & Profitability
Fundamental strength and profitability metrics provide insights into CFG's operational efficiency and financial health. CFG’s return on equity is consistent at approximately 6.96%, indicating effective use of equity capital.
| Key Metric | 2025 | 2024 | 2023 |
|---|---|---|---|
| Return on Equity | 6.96% | 6.22% | 6.61% |
| Return on Assets | 0.81% | 0.69% | 0.72% |
| Net Margin | 16.42% | 12.22% | 13.19% |
| EBIT Margin | 20.88% | 15.29% | 16.66% |
| EBITDA Margin | 24.17% | 19.32% | 20.58% |
| Gross Margin | 69.75% | 57.56% | 61.84% |
| Research & Development to Revenue | 0% | 0% | 0% |
CFG's strong margins across the board suggest a well-managed cost structure that bolsters profitability, enhancing shareholder value.
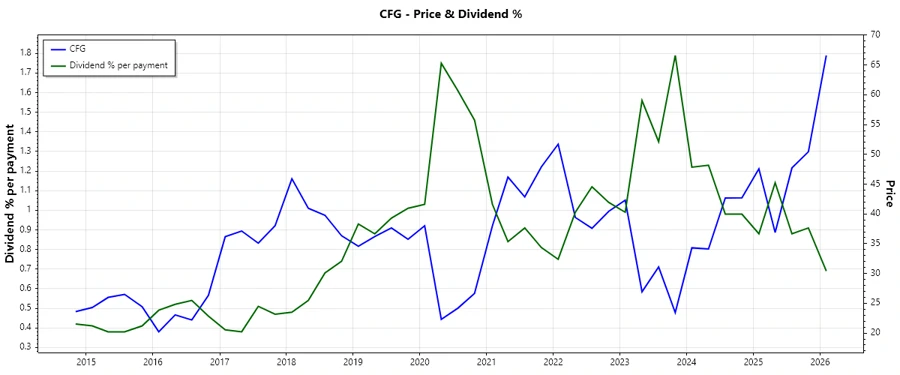
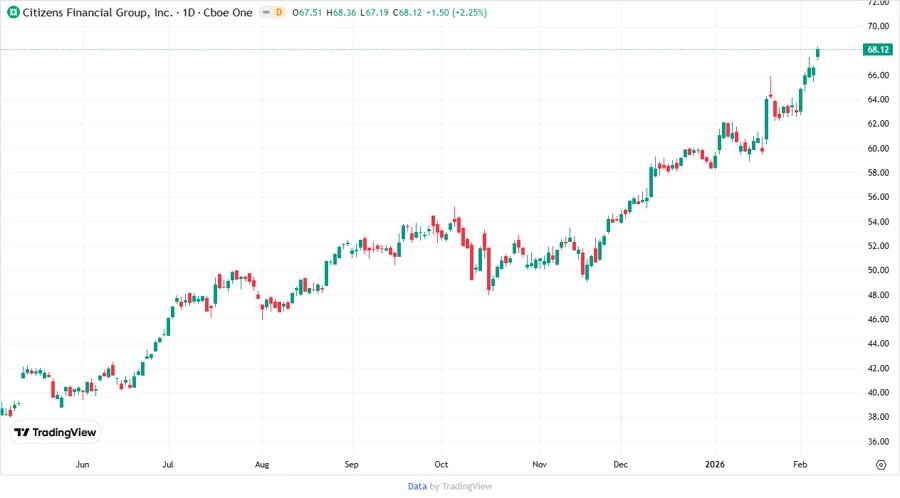
🔔 Price Development
🚥 Dividend Scoring System
| Criteria | Score | |
|---|---|---|
| Dividend yield | 3 | |
| Dividend Stability | 4 | |
| Dividend growth | 2 | |
| Payout ratio | 4 | |
| Financial stability | 3 | |
| Dividend continuity | 5 | |
| Cashflow Coverage | 4 | |
| Balance Sheet Quality | 3 |
Total Score: 28/40
⭐ Rating
Citizens Financial Group, Inc. exhibits strong fundamentals, a stable dividend profile, and a commitment to shareholder returns. Overall, CFG is a reliable choice for investors seeking steady dividend income with an emphasis on financial stability. However, a conservative growth outlook suggests the need for a balanced approach to portfolio diversity.
Smart Data Insight
Master the Perfect Entry & Exit for this Stock
Don't leave your profits to chance. Historically, this stock follows specific seasonal patterns that institutional traders use to maximize returns.
- ✅ Identify the "Golden Buying Window"
- ✅ Avoid high-risk correction cycles
- ✅ Backtested data from the last 20+ years