October 16, 2025 a 11:31 am
CFG: Dividend Analysis - Citizens Financial Group, Inc.
Citizens Financial Group, Inc. demonstrates a robust dividend profile with a stable history of payments over the past 12 years. The company offers a competitive dividend yield of 3.33%, positioning it as an attractive option for income-focused investors. Despite moderate dividend growth, the company's financial and operational metrics suggest strength and resilience in maintaining shareholder returns.
📊 Overview
Citizens Financial Group, Inc. offers a stable dividend yield and a compelling dividend history. The stable nature of its dividends, combined with its market positioning in the competitive financial sector, makes it a reliable entity for long-term returns.
| Metric | Value |
|---|---|
| Sector | Financial |
| Dividend yield | 3.33 % |
| Current dividend per share | 2.00 USD |
| Dividend history | 12 years |
| Last cut or suspension | None |
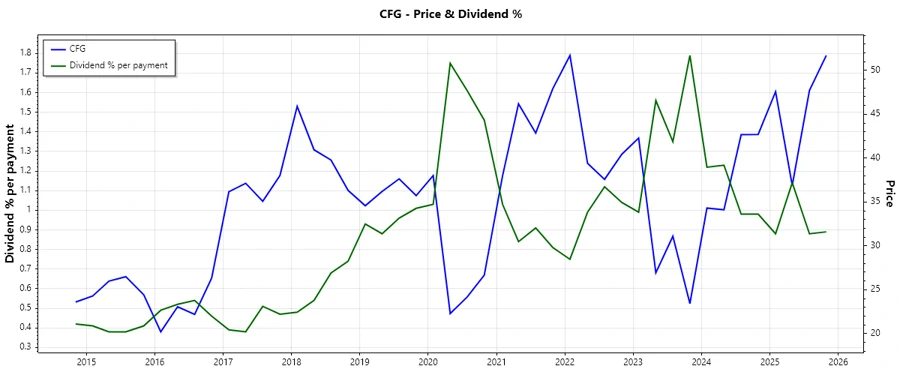
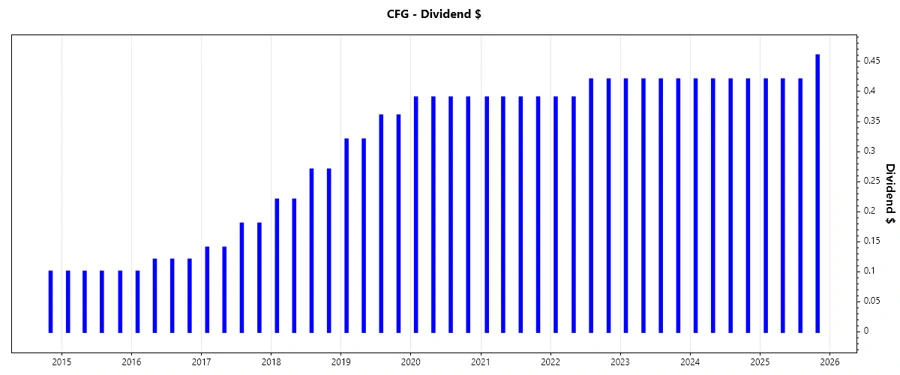
🗣️ Dividend History
CFG's dividend history reflects a commitment to delivering consistent shareholder value. This consistent payment stream is a hallmark of financial stability and investor trust, crucial for attracting long-term investors.
The image above depicts the dividend trajectory over recent years, indicating CFG's stability in shareholder returns.
| Year | Dividend per Share (USD) |
|---|---|
| 2025 | 1.72 |
| 2024 | 1.68 |
| 2023 | 1.68 |
| 2022 | 1.62 |
| 2021 | 1.56 |
📈 Dividend Growth
The growth of CFG's dividends over recent years serves as a barometer of potential future increases and signals the company's financial health and shareholder priorities.
| Time | Growth |
|---|---|
| 3 years | 2.50 % |
| 5 years | 4.32 % |
The average dividend growth is 4.32% over 5 years. This shows moderate but steady dividend growth.
✅ Payout Ratio
The payout ratio is a critical measure of how well earnings support dividend payments. CFG's ratios indicate a thoughtful balance between return and reinvestment.
| Key figure | Ratio |
|---|---|
| EPS-based | 54.58 % |
| Free cash flow-based | 74.70 % |
CFG's EPS payout ratio of 54.58% and FCF-based payout of 74.70% suggest a balance that supports both operational flexibility and shareholder returns.
💼 Cashflow & Capital Efficiency
Examining cash flow and capital efficiency is essential in understanding how well CFG generates returns from its operations and reinvests in growth.
| Metric | 2024 | 2023 | 2022 |
|---|---|---|---|
| Free Cash Flow Yield | 9.53 % | 17.71 % | 21.31 % |
| Earnings Yield | 7.65 % | 10.21 % | 11.06 % |
| CAPEX to Operating Cash Flow | 6.10 % | 5.81 % | 3.06 % |
| Stock-based Compensation to Revenue | 0.79 % | 0.71 % | 0.93 % |
| Free Cash Flow / Operating Cash Flow Ratio | 93.90 % | 94.19 % | 96.94 % |
These metrics indicate CFG efficiently uses its capital to generate returns, maintain liquidity, and support dividend payments, which is critical for sustainable growth.
📉 Balance Sheet & Leverage Analysis
CFG's balance sheet health and leverage ratios provide insight into its ability to manage debt and maintain financial stability.
| Metric | 2024 | 2023 | 2022 |
|---|---|---|---|
| Debt-to-Equity | 51.13 % | 57.40 % | 67.07 % |
| Debt-to-Assets | 5.70 % | 6.29 % | 7.01 % |
| Debt-to-Capital | 33.83 % | 36.47 % | 40.15 % |
| Net Debt to EBITDA | 0.49 | 0.77 | 1.57 |
| Current Ratio | 0.25 | 0.24 | 0.20 |
| Quick Ratio | 0.25 | 0.24 | 0.20 |
| Financial Leverage | 8.97 | 9.12 | 9.57 |
CFG maintains a conservative debt structure with improving metrics over the years, allowing it to withstand economic fluctuations while supporting dividends.
📈 Fundamental Strength & Profitability
Profitability and fundamental strengths highlight CFG's operational efficiency and capacity to reward shareholders through consistent returns.
| Metric | 2024 | 2023 | 2022 |
|---|---|---|---|
| Return on Equity | 6.22 % | 6.61 % | 8.75 % |
| Return on Assets | 0.69 % | 0.72 % | 0.91 % |
| Return on Invested Capital | 3.53 % | 3.60 % | 4.51 % |
| Net Margin | 12.22 % | 13.19 % | 22.86 % |
| EBIT Margin | 15.29 % | 16.66 % | 29.28 % |
| EBITDA Margin | 19.32 % | 20.58 % | 35.51 % |
| Gross Margin | 57.56 % | 61.84 % | 83.22 % |
CFG's margins and returns are indicative of strong operational outcomes, thereby buttressing its reputation for delivering substantial shareholder value.
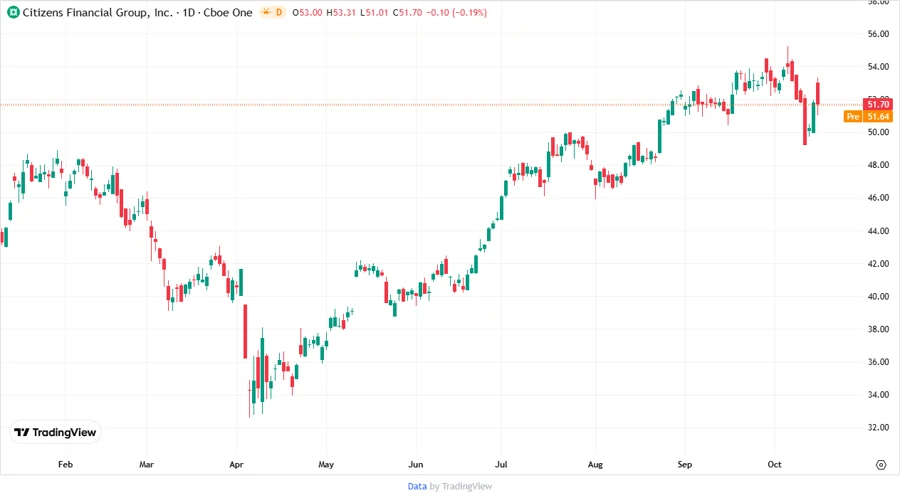
Price Development
🎯 Dividend Scoring System
| Criteria | Score (1-5) | |
|---|---|---|
| Dividend yield | 4 | |
| Dividend Stability | 5 | |
| Dividend growth | 3 | |
| Payout ratio | 4 | |
| Financial stability | 4 | |
| Dividend continuity | 5 | |
| Cashflow Coverage | 4 | |
| Balance Sheet Quality | 4 |
Overall Score: 33/40
🏆 Rating
CFG presents as a strong income stock with robust dividend features and solid financial health. For dividend-focused investors looking for a stable and growing income stream, CFG is a recommendable buy, given its consistent dividend record and sound fiscal metrics.
Smart Data Insight
Master the Perfect Entry & Exit for this Stock
Don't leave your profits to chance. Historically, this stock follows specific seasonal patterns that institutional traders use to maximize returns.
- ✅ Identify the "Golden Buying Window"
- ✅ Avoid high-risk correction cycles
- ✅ Backtested data from the last 20+ years