August 23, 2025 a 03:31 pm

CFG: Dividend Analysis - Citizens Financial Group, Inc.
Citizens Financial Group, Inc. offers a promising dividend profile with a yield of 3.52%, supported by a consistent dividend history spanning over 12 years. Despite a moderate EPS payout ratio of 54.57%, the financial stability and growth prospects appear robust, indicating potential for sustained dividend payments. The recent absence of any cuts or suspensions further solidifies trust in its dividend policy.
📊 Overview
Citizens Financial, operating in the financial sector, presents a stable dividend yield of 3.52%, with a current dividend per share at $2.00. The company boasts a commendable 12-year history of uninterrupted dividends, signaling reliability to long-term investors.
| Metric | Value |
|---|---|
| Sector | Financial |
| Dividend yield | 3.52% |
| Current dividend per share | $2.00 |
| Dividend history | 12 years |
| Last cut or suspension | None |
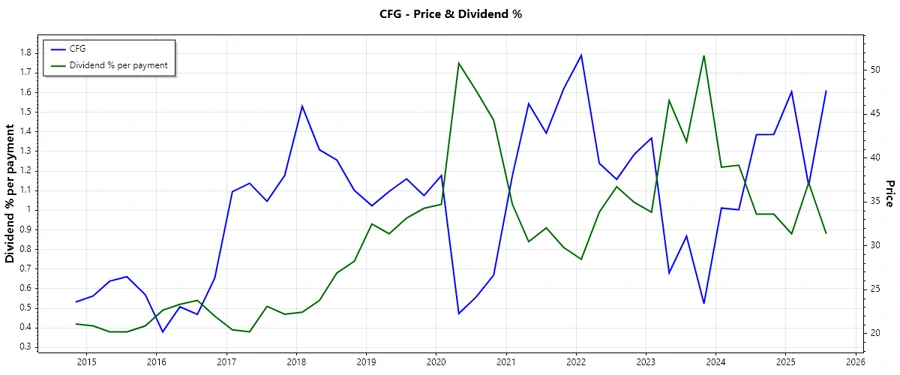
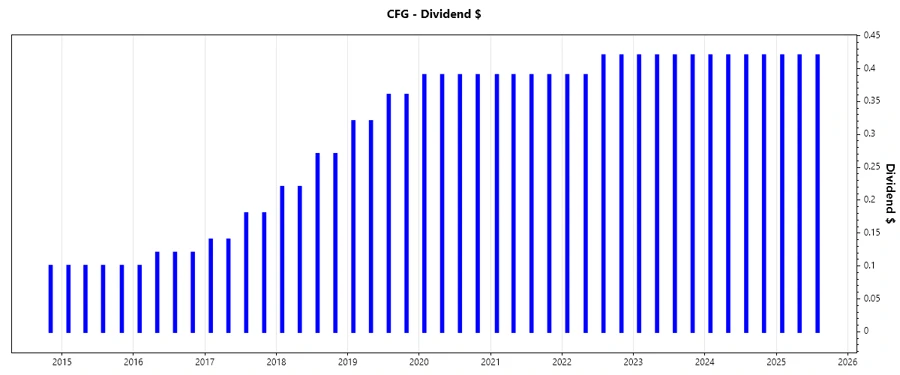
📈 Dividend History
Citizens Financial Group has maintained a solid dividend payment history, reflecting strong cash flow management. Analyzing historical payouts is crucial for assessing the company's commitment to shareholders and the predictability of future dividends.
| Year | Dividend Per Share |
|---|---|
| 2025 | $1.26 |
| 2024 | $1.68 |
| 2023 | $1.68 |
| 2022 | $1.62 |
| 2021 | $1.56 |
📈 Dividend Growth
Dividend growth over time demonstrates a company's capacity to enhance shareholder return. Citizens Financial's growth of 4.32% over five years highlights a moderate, steady upward trend, signifying potential for future dividend increases aligned with financial health.
| Time | Growth |
|---|---|
| 3 years | 2.50% |
| 5 years | 4.32% |
The average dividend growth is 4.32% over 5 years. This shows moderate but steady dividend growth.
🗣️ Payout Ratio
The payout ratios are crucial indicators of the sustainability of dividends. Citizens Financial exhibits a conservative payout based on its EPS (54.57%) and a slightly higher free cash flow-based payout ratio (78.00%), offering insight into both retained earnings for growth and continued shareholder returns.
| Key figure | Ratio |
|---|---|
| EPS-based | 54.58% |
| Free cash flow-based | 78.00% |
These payout figures suggest that CFG maintains a prudent balance between rewarding shareholders and reinvesting in the business, with the EPS-based ratio indicating healthy room for future dividend increases.
📉 Cashflow & Capital Efficiency
The company's ability to generate consistent cash flows while efficiently utilizing capital is vital for enduring profitability and sustained dividends.
| Year | 2022 | 2023 | 2024 |
|---|---|---|---|
| Free Cash Flow Yield | 21.31% | 17.71% | 9.53% |
| Earnings Yield | 11.06% | 10.21% | 7.65% |
| CAPEX to Operating Cash Flow | 3.06% | 5.81% | 6.10% |
| Stock-based Compensation to Revenue | 0.93% | 0.71% | 0.79% |
| Free Cash Flow / Operating Cash Flow Ratio | 96.94% | 94.19% | 93.90% |
Citizens Financial exhibits strong cash flow efficiency, with a robust free cash flow yield and well-maintained CAPEX ratios ensuring capital is effectively employed.
🗣️ Balance Sheet & Leverage Analysis
A thorough examination of leverage metrics aids in evaluating a company's capacity to manage and service its debt, which is critical for financial stability.
| Year | 2022 | 2023 | 2024 |
|---|---|---|---|
| Debt-to-Equity | 0.67 | 0.57 | 0.51 |
| Debt-to-Assets | 7.01% | 6.29% | 5.70% |
| Debt-to-Capital | 40.15% | 36.47% | 33.83% |
| Net Debt to EBITDA | 1.57 | 0.77 | 0.49 |
| Current Ratio | 0.20 | 0.24 | 0.25 |
| Quick Ratio | 0.20 | 0.24 | 0.25 |
| Financial Leverage | 9.57 | 9.12 | 8.97 |
Despite a relatively high financial leverage, CFG has been successfully reducing its debt-to-equity and improving its liquidity ratios, enhancing financial resilience.
📝 Fundamental Strength & Profitability
Evaluating fundamental metrics is essential for understanding how efficiently a company generates profits and maximizes shareholder value.
| Year | 2022 | 2023 | 2024 |
|---|---|---|---|
| Return on Equity | 8.75% | 6.61% | 6.22% |
| Return on Assets | 0.91% | 0.72% | 0.69% |
| Net Profit Margin | 22.86% | 13.19% | 12.22% |
| EBIT Margin | 29.28% | 16.66% | 15.29% |
| EBITDA Margin | 35.51% | 20.58% | 19.32% |
| Gross Profit Margin | 83.22% | 61.84% | 57.56% |
| Research & Development to Revenue | 0% | 0% | 0% |
CFG demonstrates strengthened profitability with impressive margins, particularly the gross profit margin, indicating effective cost management and operational efficiency.
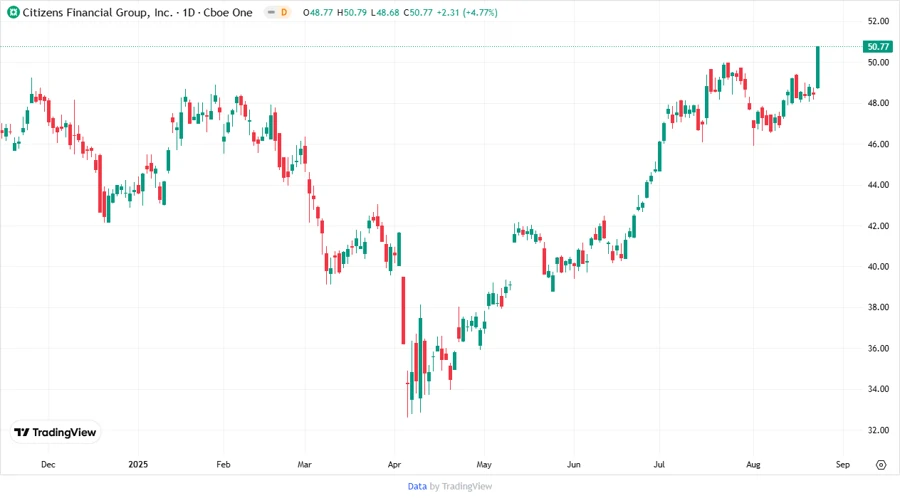
📉 Price Development
✅ Dividend Scoring System
| Category | Score | |
|---|---|---|
| Dividend yield | 4 | |
| Dividend Stability | 5 | |
| Dividend growth | 3 | |
| Payout ratio | 3 | |
| Financial stability | 4 | |
| Dividend continuity | 5 | |
| Cashflow Coverage | 4 | |
| Balance Sheet Quality | 4 |
Total Score: 32/40
✅ Rating
Our comprehensive analysis of Citizens Financial Group, Inc. suggests a strong dividend profile backed by solid financials and operational efficiency. With a total score of 32 out of a possible 40, we recommend CFG as a reliable investment for income-seeking investors. The stable dividend history and prudent capital management reflect an encouraging long-term shareholder value proposition.
Smart Data Insight
Master the Perfect Entry & Exit for this Stock
Don't leave your profits to chance. Historically, this stock follows specific seasonal patterns that institutional traders use to maximize returns.
- ✅ Identify the "Golden Buying Window"
- ✅ Avoid high-risk correction cycles
- ✅ Backtested data from the last 20+ years