June 24, 2025 a 03:31 pm

CFG: Dividend Analysis - Citizens Financial Group, Inc.
Citizens Financial Group, Inc. presents a solid dividend profile characterized by a robust yield and promising growth potential. The company's historical dividend consistency, coupled with a moderate payout ratio, underscores its strong commitment to returning value to shareholders. While navigating challenges in the financial sector, CFG has demonstrated resilience through stable fundamentals and prudent financial management.
📊 Overview
CFG delivers a compelling dividend profile, anchored in a strong sector representation, attractive yield, and a formidable history of continuous dividends over the past 12 years.
| Metric | Value |
|---|---|
| Sector | Financials |
| Dividend yield | 4.55 % |
| Current dividend per share | 2.00 USD |
| Dividend history | 12 years |
| Last cut or suspension | None |
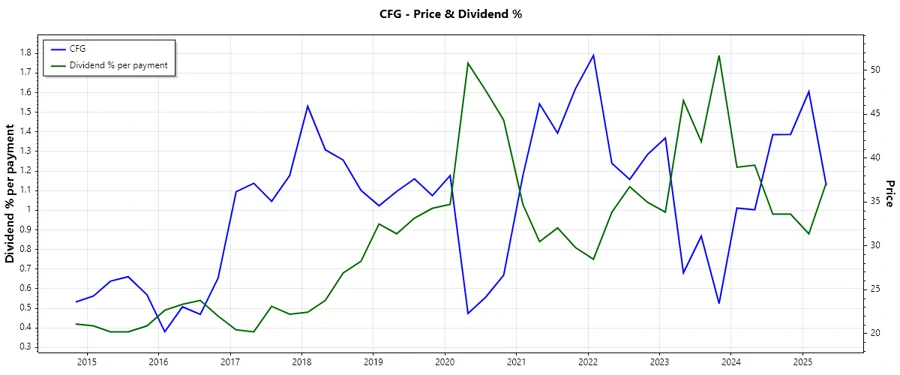
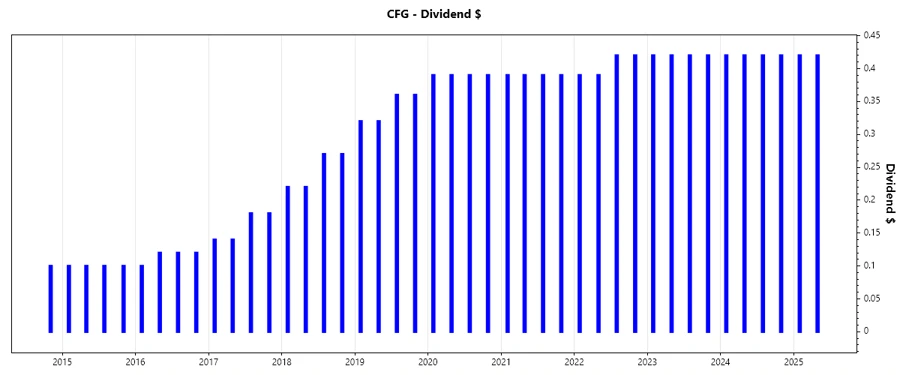
🗓️ Dividend History
The rich dividend history for CFG highlights its strong commitment to consistent shareholder returns, playing a crucial role in long-term investment strategies by building trust and providing predictable income.
| Year | Dividend per Share (USD) |
|---|---|
| 2025 | 0.84 |
| 2024 | 1.68 |
| 2023 | 1.68 |
| 2022 | 1.62 |
| 2021 | 1.56 |
📈 Dividend Growth
Dividend growth is a compelling metric for gauging the potential for increasing shareholder returns. CFG's growth trajectory is commendable and suggests robust future potential.
| Time | Growth |
|---|---|
| 3 years | 2.50 % |
| 5 years | 4.32 % |
The average dividend growth is 4.32 % over 5 years. This shows moderate but steady dividend growth.
💼 Payout Ratio
Payout ratios reflect CFG's capacity to sustain its dividends. A balanced ratio indicates prudent financial management and supports ongoing shareholder returns without jeopardizing growth or financial stability.
| Key figure ratio | Value |
|---|---|
| EPS-based | 56.73 % |
| Free cash flow-based | 78.42 % |
The EPS payout ratio of 56.73 % and the FCF ratio of 78.42 % are within healthy ranges, indicating CFG’s capability to maintain dividend payments.
🤑 Cashflow & Capital Efficiency
Analyzing cash flow and capital efficiency provides insight into CFG's ability to sustain operations and investments while maximizing returns, essential for long-term strategic growth.
| Metric | 2024 | 2023 | 2022 |
|---|---|---|---|
| Free Cash Flow Yield | 9.53 % | 17.71 % | 21.31 % |
| Earnings Yield | 7.65 % | 10.21 % | 11.06 % |
| CAPEX to Operating Cash Flow | 6.10 % | 5.81 % | 3.06 % |
| Stock-based Compensation to Revenue | 0.79 % | 0.71 % | 0.93 % |
| Free Cash Flow / Operating Cash Flow Ratio | 93.90 % | 94.19 % | 96.94 % |
CFG demonstrates robustness in cash flow metrics, suggesting efficient capital management and reliable cash generation critical for sustaining dividend payments and growth investments.
🧾 Balance Sheet & Leverage Analysis
Evaluating leverage and balance sheet stability is vital for understanding CFG’s financial health, particularly its ability to maneuver debt in coherent financial strategies.
| Metric | 2024 | 2023 | 2022 |
|---|---|---|---|
| Debt-to-Equity | 51.13 % | 57.40 % | 67.07 % |
| Debt-to-Assets | 5.70 % | 6.29 % | 7.01 % |
| Debt-to-Capital | 33.83 % | 36.47 % | 40.15 % |
| Net Debt to EBITDA | 0.49 | 0.77 | 1.57 |
| Current Ratio | 25.39 % | 24.09 % | 19.94 % |
| Quick Ratio | 25.39 % | 24.09 % | 19.94 % |
CFG's balance sheet metrics indicate a sound financial condition with effective debt management, ensuring operational liquidity and future financial resilience.
🏆 Fundamental Strength & Profitability
Examining fundamental strength gives insights into CFG's core operational efficiency and profitability, crucial for sustaining competitive edge and rewarding shareholders.
| Metric | 2024 | 2023 | 2022 |
|---|---|---|---|
| Return on Equity | 6.22 % | 6.61 % | 8.75 % |
| Return on Assets | 0.69 % | 0.72 % | 0.91 % |
| Net Margin | 12.22 % | 13.19 % | 22.86 % |
| EBIT Margin | 15.29 % | 16.66 % | 29.28 % |
| EBITDA Margin | 19.32 % | 20.58 % | 35.51 % |
| Gross Margin | 57.56 % | 61.84 % | 83.22 % |
CFG's profitability and operational margins demonstrate significant strength, positioning it well for sustainable growth and shareholder value generation.
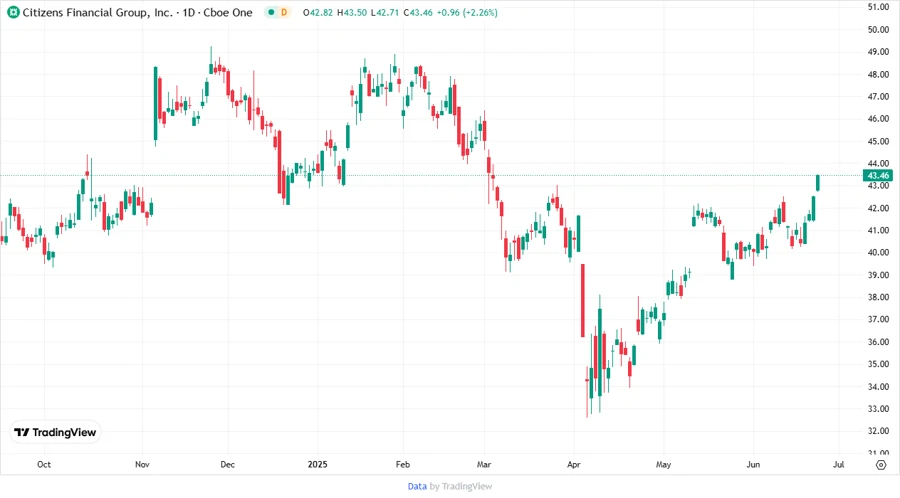
📉 Price Development
✅ Dividend Scoring System
| Criteria | Rating (1-5) | Score |
|---|---|---|
| Dividend yield | 5 | |
| Dividend Stability | 4 | |
| Dividend growth | 4 | |
| Payout ratio | 3 | |
| Financial stability | 4 | |
| Dividend continuity | 4 | |
| Cashflow Coverage | 5 | |
| Balance Sheet Quality | 3 |
Overall Score: 32/40
🔍 Rating
Citizens Financial Group, Inc. presents a compelling dividend profile with a high yield, consistent growth trajectory, and strong cash flow coverage. However, careful monitoring of payout ratios and balance sheet health is suggested. Overall, CFG remains an attractive choice for dividend-focused investors, seeking stable income alongside moderate growth potential.
Smart Data Insight
Master the Perfect Entry & Exit for this Stock
Don't leave your profits to chance. Historically, this stock follows specific seasonal patterns that institutional traders use to maximize returns.
- ✅ Identify the "Golden Buying Window"
- ✅ Avoid high-risk correction cycles
- ✅ Backtested data from the last 20+ years