July 03, 2026 a 09:03 am
CDW: Trend and Support & Resistance Analysis - CDW Corporation
The CDW Corporation stock has been demonstrating a mix of volatile and stable movements. This analysis reveals that the stock is influenced significantly by the broader IT services demand within North America and the UK markets. CDW Corporation's strategic offerings in data center infrastructure, network management, and digital workspaces seem to align well with current market needs. However, market fluctuations and technological advancements present both opportunities and challenges.
Trend Analysis
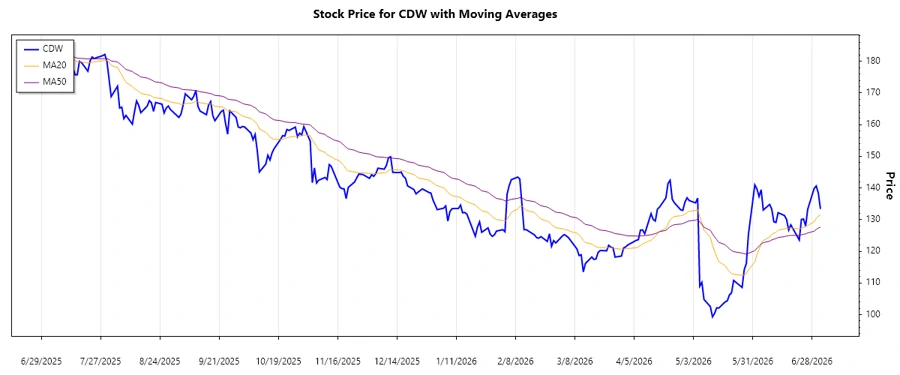
Upon analyzing the historical closing prices, the recent data suggests a recovery from a previous downtrend with signs of stabilization. The calculated EMAs provide clearer insights:
| Date | Closing Price | Trend |
|---|---|---|
| 2026-07-02 | $133.37 | ⚖️ |
| 2026-07-01 | $138.41 | ▲ |
| 2026-06-30 | $140.64 | ▲ |
| 2026-06-29 | $139.82 | ▲ |
| 2026-06-26 | $133.30 | ⚖️ |
| 2026-06-25 | $128.02 | ⚖️ |
| 2026-06-24 | $130.22 | ⚖️ |
The EMA20 is slightly converging with the EMA50, indicating an emerging stabilization phase from a potential turnaround.
Support- and Resistance
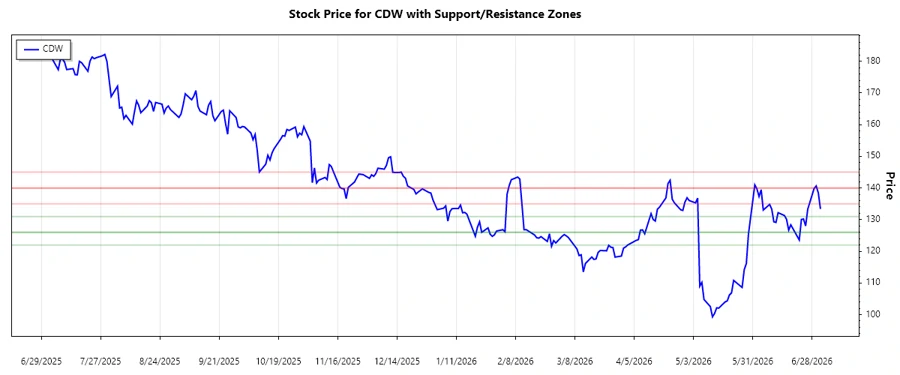
The analysis identifies two critical support and resistance levels based on recent closed prices, signaling important price zones.
| Zone Type | From | To |
|---|---|---|
| Resistance ☝️ | $140.00 | $145.00 |
| Support 👇 | $126.00 | $131.00 |
| Resistance ☝️ | $135.00 | $140.00 |
| Support 👇 | $122.00 | $126.00 |
Currently, the stock price is lingering around the lower bound of the nearest resistance zone, indicating a potential breakout or consolidation.
Conclusion
The technical analysis of CDW Corporation suggests a period of stabilization with potential upward momentum in the short-term horizon. The company's diverse IT service offerings may sustain investor interest, yet market volatility remains a key concern. Carefully monitoring the established support and resistance zones can provide insights into future price movements.
Smart Data Insight
Master the Perfect Entry & Exit for this Stock
Don't leave your profits to chance. Historically, this stock follows specific seasonal patterns that institutional traders use to maximize returns.
- ✅ Identify the "Golden Buying Window"
- ✅ Avoid high-risk correction cycles
- ✅ Backtested data from the last 20+ years