September 23, 2025 a 08:15 am
CDW: Trend and Support & Resistance Analysis - CDW Corporation
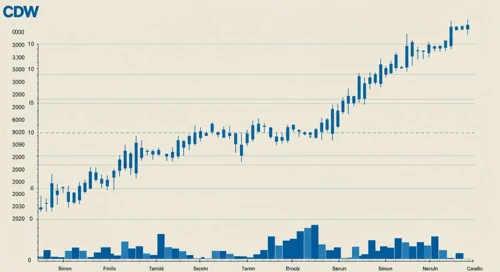
The CDW Corporation, a leader in providing IT solutions, has demonstrated varied stock movements over recent months. With its strong presence in the Corporate, Small Business, and Public sectors, CDW's performance is a reflection of both industry trends and internal efficiency. Investors are keenly observing the trends, especially given the recent fluctuations observed in the market. As companies shift to more robust IT infrastructures, CDW appears poised to capitalize on this evolution. This analysis will shed light on the technical trends and potential support/resistance zones for a more informed investment decision.
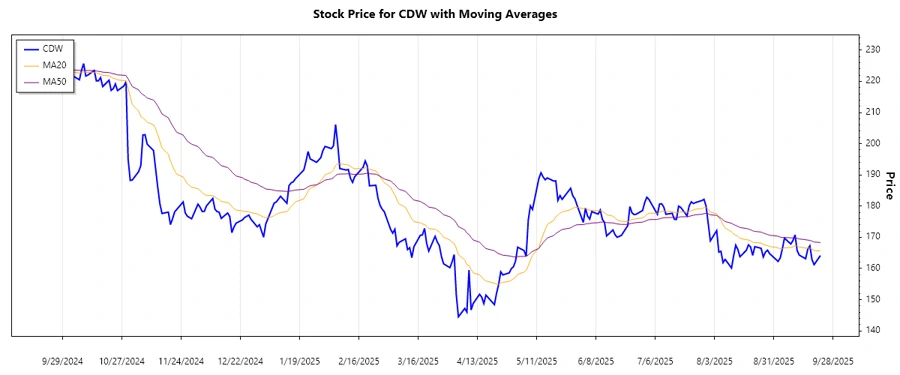
Trend Analysis
Based on the historical data, the moving averages, specifically the EMA20 and EMA50, have been calculated to determine the predominant trend. The EMA20 appears to be slightly above the EMA50 suggesting a mild upward trend, however, recent prices depict fluctuations that are worth noting.
| Date | Closing Price | Trend |
|---|---|---|
| Sep 22, 2025 | 164.16 | ▲ Upward Trend |
| Sep 19, 2025 | 161.22 | ▼ Downward Trend |
| Sep 18, 2025 | 162.87 | ▲ Upward Trend |
| Sep 17, 2025 | 167.29 | ▲ Upward Trend |
| Sep 16, 2025 | 166.15 | ▼ Downward Trend |
| Sep 15, 2025 | 163.13 | ▼ Downward Trend |
| Sep 12, 2025 | 164.29 | ▲ Upward Trend |
The recent data suggests volatility in the stock price, though the overarching trend appears mildly positive. This can potentially be attributed to market sentiment and industry shifts that CDW navigates.
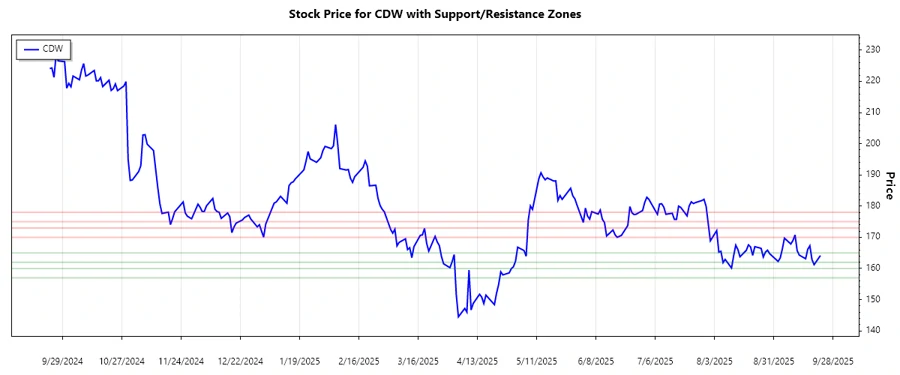
Support and Resistance
An analysis of support and resistance levels indicates key zones for potential price reversals. These levels can act as psychological barriers for traders, influencing market movements.
| Zone Type | From | To |
|---|---|---|
| Support | 165.00 | 162.00 |
| Support | 160.00 | 157.00 |
| Resistance | 170.00 | 173.00 |
| Resistance | 175.00 | 178.00 |
The current price is near the lower resistance zone, suggesting potential upward resistance. This positioning can affect investor decisions moving forward, as breaking these zones could lead to strong bullish trends or falter at the resistance points.
Conclusion
The CDW Corporation stock is positioned between crucial support and resistance zones, indicating potential volatility. As the IT sector looks to expand, CDW's engagement with various market segments could yield positive outcomes for shareholders. However, the marked changes in trend direction underscore the importance of cautious investment strategies amid fluctuating sentiments. The computed EMA values reflect a slight bullish tilt, encouraging optimism among traders. Still, close monitoring of both internal performances and broader economic indicators will be vital in predicting future stock trajectories.
Smart Data Insight
Master the Perfect Entry & Exit for this Stock
Don't leave your profits to chance. Historically, this stock follows specific seasonal patterns that institutional traders use to maximize returns.
- ✅ Identify the "Golden Buying Window"
- ✅ Avoid high-risk correction cycles
- ✅ Backtested data from the last 20+ years