
August 02, 2025 a 03:15 pm
CDW: Fibonacci Analysis - CDW Corporation
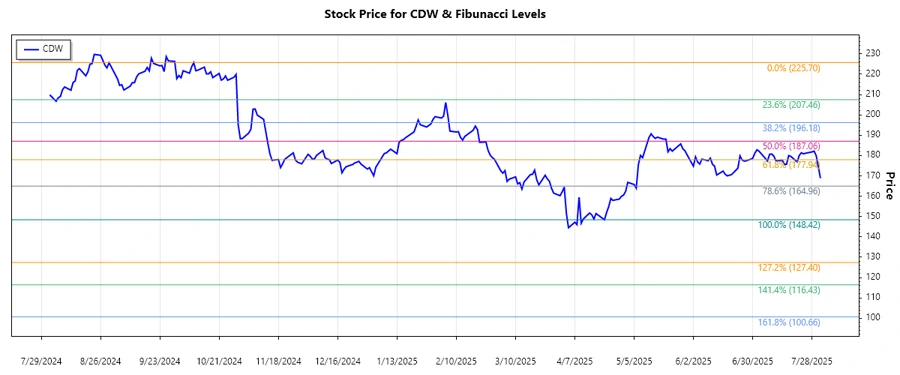
CDW Corporation, a leading provider of IT solutions, showcases resilience in a volatile market. Currently, the stock is navigating a retracement phase, epitomizing the challenges of maintaining growth amidst fluctuating demand in the tech industry. Analysts closely watch its performance, with focus areas on its ability to leverage hybrid and cloud capabilities. CDW's adaptable service offerings remain vital in securing enduring customer relationships.
Fibonacci Analysis
| Start Date | End Date | High Price | High Date | Low Price | Low Date | Fibonacci Levels | Current Price |
|---|---|---|---|---|---|---|---|
| 2024-08-02 | 2025-07-29 | $225.70 | 2024-10-09 | $148.42 | 2025-04-21 |
|
$168.86 |
The current price of $168.86 is within the 0.236 retracement zone. This suggests a tentative recovery from the recent lower bounds and indicates a possible short-term support around this level. Analysts should monitor for a potential breakout or further pullback, affecting strategic planning.
Conclusion
Analyzing CDW Corporation's recent performance, the stock remains in a volatile retracement phase, highlighting both opportunities and risks tied to its technology-driven trajectory. Short-term support at the 0.236 Fibonacci level may forecast resilience, hinting at an upward shift if breaking beyond established resistances. Yet, sustaining such momentum demands navigating inherent tech sector uncertainties. As IT solutions evolve, CDW's strategic innovations in cloud capabilities might continue to appeal. However, potential financial fluctuations prompted by broader economic conditions emphasize the need for ongoing vigilance among analysts monitoring this dynamic market environment.
Smart Data Insight
Master the Perfect Entry & Exit for this Stock
Don't leave your profits to chance. Historically, this stock follows specific seasonal patterns that institutional traders use to maximize returns.
- ✅ Identify the "Golden Buying Window"
- ✅ Avoid high-risk correction cycles
- ✅ Backtested data from the last 20+ years