June 13, 2025 a 04:44 pm
CDW: Fibonacci Analysis - CDW Corporation
CDW Corporation has shown a strong capability to adapt to market changes with its diverse IT solutions portfolio. Over the reviewed period, CDW experienced significant price fluctuations, reflecting underlying market volatility, which provides both opportunities and challenges. The latest trend suggests a potential recovery, contingent upon overcoming key resistance levels identified in technical analysis. Investors should watch for breakthrough indicators as part of their strategic decision-making.
Fibonacci Analysis
| Parameter | Details |
|---|---|
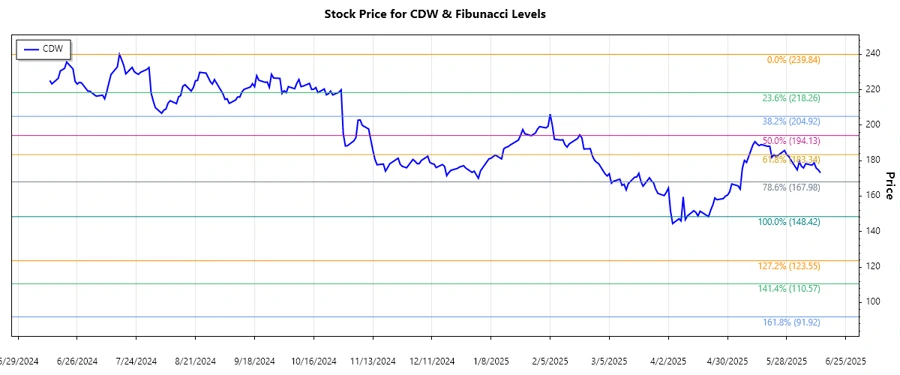
| Trend Start Date | 2024-07-17 |
| Trend End Date | 2025-05-13 |
| High Price | $239.84 on 2024-07-16 |
| Low Price | $148.42 on 2025-04-21 |
| Fibonacci Levels |
|
| Current Price Activity | The current price is at $173.11, within the 0.236 retracement level. |
| Technical Interpretation | The price's presence in the 0.236 retracement zone suggests a potential support level here. A sustained hold or movement above this area could signal further recovery, whereas a drop might increase downside risks. |
Conclusion
CDW Corporation demonstrates the intricate dynamics of market trends with its latest downtrend ending in April 2025. The company's ability to maintain a diverse service offering serves as a mitigative buffer against broader market declines, yet the technicals indicate cautious optimism. As prices tick upward from significant lows, a break above key Fibonacci levels may signal sustained upward momentum. However, failure to hold above these thresholds could lead to potential retests of recent lows. Analysts should consider both fundamental performance and technical signals for a holistic view of potential market behavior.
Smart Data Insight
Master the Perfect Entry & Exit for this Stock
Don't leave your profits to chance. Historically, this stock follows specific seasonal patterns that institutional traders use to maximize returns.
- ✅ Identify the "Golden Buying Window"
- ✅ Avoid high-risk correction cycles
- ✅ Backtested data from the last 20+ years