April 24, 2025 a 11:30 am

CDW: Fibonacci Analysis - CDW Corporation
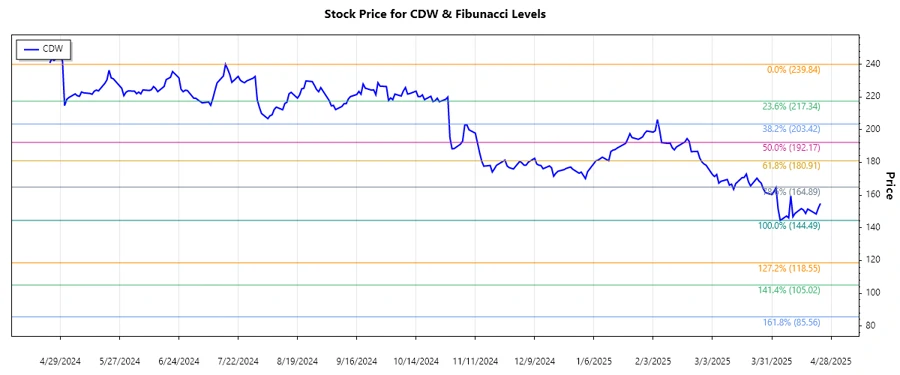
The CDW Corporation, a leader in IT solutions across the US, UK, and Canada, has experienced significant market activity in recent months. Given its strong positioning in the market and innovative product offerings, the stock remains a focus for investors. The dominant trend observed was a downward movement, warranting a close look at potential support levels using Fibonacci retracement.
Fibonacci Analysis
| Timeframe | Price Data |
|---|---|
| Start Date | 2024-07-17 |
| End Date | 2025-04-23 |
| High Price & Date | $239.84 on 2024-07-16 |
| Low Price & Date | $144.49 on 2025-04-04 |
| Fibonacci Levels |
|
| Current Price & Retracement Zone | $154.86 - Below 0.236 |
| Technical Interpretation | With the current price below the 0.236 Fibonacci level, the CDW stock is in a weak position. If the stock reaches the 0.236 level, this could form the potential first resistance point to watch, signaling a potential reversal or continued downward pressure. |
Conclusion
The CDW Corporation stock has been in a downtrend since mid-2024, now trading well below its 2024 highs. The critical Fibonacci levels indicate potential points of resistance in future price movements. Analysts should be cautious, as the stock's current price below the 0.236 Fibonacci level suggests possible further declines or support testing near the recent low. Conversely, breaking above the 0.236 level could signal renewed investor confidence and potential for recovery.
Smart Data Insight
Master the Perfect Entry & Exit for this Stock
Don't leave your profits to chance. Historically, this stock follows specific seasonal patterns that institutional traders use to maximize returns.
- ✅ Identify the "Golden Buying Window"
- ✅ Avoid high-risk correction cycles
- ✅ Backtested data from the last 20+ years