
May 25, 2026 a 07:46 am

CDW: Dividend Analysis - CDW Corporation
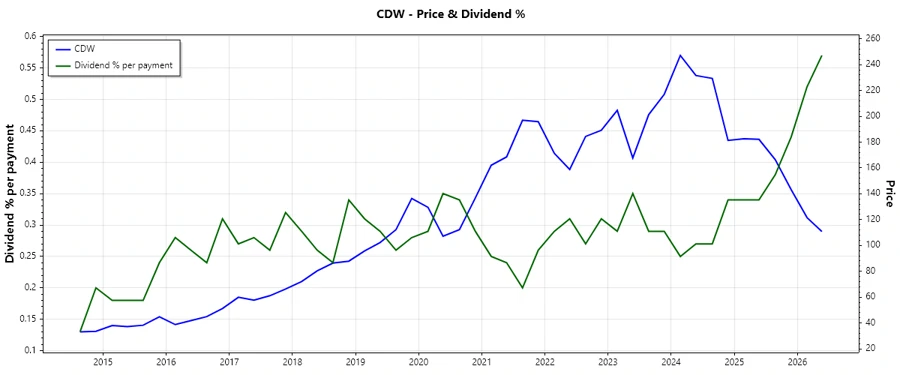
CDW Corporation has presented itself as a stable dividend payer with a history of 14 years of consistent dividends and a current dividend yield of 2.27%. The company’s approach to managing its payouts, shown by a robust EPS payout ratio of 29.97%, aligns well with its financial health and market strategy. Despite the company's moderate dividend growth rate, its consistent performance suggests a reliable income stream for investors.
📊 Overview
The overview of CDW Corporation’s dividend profile reveals insights into its business sector and payout strategies. With a dividend yield of 2.27%, CDW provides a sound return on investment compared to peers in its sector. The company's dividend per share currently stands at $2.50, with a solid history of 14 years, suggesting a longstanding commitment to shareholder returns.
| Factor | Details |
|---|---|
| Sector | Information Technology |
| Dividend Yield | 2.27% |
| Current Dividend Per Share | $2.50 |
| Dividend History | 14 years |
| Last Cut or Suspension | None |
🗣️ Dividend History
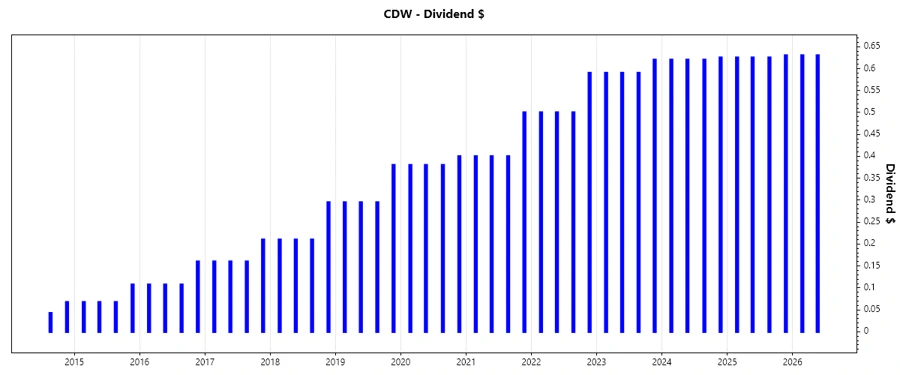
Examining CDW’s dividend history is crucial as it reflects the company's ability and commitment to reward shareholders over time. A steady history mitigates the risk for dividend-oriented investors. The data indicates uninterrupted distribution, enhancing investor confidence in the company's financial fortitude.
| Year | Dividend Per Share (USD) |
|---|---|
| 2026 | 1.26 |
| 2025 | 2.505 |
| 2024 | 2.485 |
| 2023 | 2.39 |
| 2022 | 2.09 |
📈 Dividend Growth
Dividend growth is a key consideration for investors seeking not only consistent income but also capital appreciation. An analysis over the last few years indicates that CDW has been able to steadily increase dividend payments, albeit at a moderate pace, which suggests financial stability and growth potential.
| Time Period | Growth |
|---|---|
| 3 Years | 6.22% |
| 5 Years | 10.22% |
The average dividend growth is 10.22% over 5 years. This shows moderate but steady dividend growth.
💹 Payout Ratio
The payout ratio is an essential measure of the sustainability of a company’s dividend payments. For CDW, the EPS-based payout is 29.97% and FCF-based is 29.71%, both indicating a healthy buffer for continued payouts. Such ratios provide comfort that dividends are well-covered by earnings and cash flow, pointing toward prudent financial management.
| Key Figure | Ratio |
|---|---|
| EPS-based | 29.97% |
| Free Cash Flow-based | 29.71% |
📉 Cashflow & Capital Efficiency
Understanding cash flow dynamics and capital efficiency is critical when assessing a company's ability to sustain and grow dividends. The table below illustrates CDW's strong cash flow generation, vital for covering its dividend commitments without leveraging too much debt.
| Year | 2023 | 2024 | 2025 |
|---|---|---|---|
| Free Cash Flow Yield | 7.60% | 4.96% | 6.08% |
| Earnings Yield | 7.53% | 4.63% | 5.96% |
| CAPEX to Operating Cash Flow | 9.78% | 9.60% | 9.72% |
| Stock-based Compensation to Revenue | 0.22% | 0.31% | 0.22% |
| Free Cash Flow / Operating Cash Flow Ratio | 90.28% | 90.40% | 90.28% |
💼 Balance Sheet & Leverage Analysis
A critical assessment of the balance sheet reveals the leverage strategies CDW employs. The ratios show a relatively high use of debt, indicating financial measures to leverage growth. Ensuring that debt remains at manageable levels is crucial for maintaining financial health and preserving shareholder value.
| Year | 2023 | 2024 | 2025 |
|---|---|---|---|
| Debt-to-Equity | 2.84 | 2.55 | 2.43 |
| Debt-to-Assets | 43.73% | 40.82% | 39.50% |
| Debt-to-Capital | 73.99% | 71.81% | 70.84% |
| Net Debt to EBITDA | 2.68 | 2.85 | 2.93 |
| Current Ratio | 1.23 | 1.35 | 1.18 |
| Quick Ratio | 1.11 | 1.24 | 1.10 |
| Financial Leverage | 6.50 | 6.23 | 6.15 |
📈 Fundamental Strength & Profitability
Reviewing profitability metrics gives insight into CDW's operational efficacy and economic moat. The returns on equity and assets reflect strong, well-maintained profitability with adequate reinvestment of capital driving their business forward.
| Year | 2023 | 2024 | 2025 |
|---|---|---|---|
| Return on Equity | 54.07% | 45.81% | 40.93% |
| Return on Assets | 8.31% | 7.34% | 6.65% |
| Margins: Net | 5.17% | 5.13% | 4.76% |
| Margins: EBIT | 7.84% | 7.86% | 7.38% |
| Margins: EBITDA | 9.11% | 9.17% | 8.70% |
| Margins: Gross | 21.76% | 21.92% | 21.73% |
| R&D to Revenue | 0% | 0% | 0% |
💹 Price Development
✅ Dividend Scoring System
Our dividend scoring system evaluates CDW Corporation based on several criteria to provide a comprehensive overview of its dividend strength.
| Criteria | Score | Indicator |
|---|---|---|
| Dividend Yield | 4 | |
| Dividend Stability | 5 | |
| Dividend Growth | 3 | |
| Payout Ratio | 5 | |
| Financial Stability | 4 | |
| Dividend Continuity | 5 | |
| Cashflow Coverage | 4 | |
| Balance Sheet Quality | 3 |
Total Score: 33/40
💭 Rating
Overall, CDW Corporation demonstrates robust dividend credentials with significant potential for income investors seeking a balanced risk-reward profile. While the dividend growth is moderate, it’s buttressed by a strong financial foundation and a strategic payout ratio management. The financial health indicators show that CDW is well-capitalized to uphold its commitments, making it a solid choice for dividend portfolios.
Smart Data Insight
Master the Perfect Entry & Exit for this Stock
Don't leave your profits to chance. Historically, this stock follows specific seasonal patterns that institutional traders use to maximize returns.
- ✅ Identify the "Golden Buying Window"
- ✅ Avoid high-risk correction cycles
- ✅ Backtested data from the last 20+ years