May 09, 2026 a 07:46 am


CDW: Dividend Analysis - CDW Corporation
As a leading technology solutions company, CDW Corporation has established a promising dividend profile with a robust history of increasing dividend payouts. With a modest dividend yield and a consistent history of payment without interruptions, CDW remains an appealing choice for dividend-focused investors. Its strong financial fundamentals and prudent management of payout ratios further strengthen its positioning in the dividend growth investable universe.
📊 Overview
CDW Corporation, functioning prominently within the technology sector, presents a dividend yield of 2.40%. With an annual dividend per share of USD 2.50 and a history spanning 14 years sans suspension, the firm demonstrates reliability in its distributions. Importantly, there have been no recent cuts, enhancing its standing among dividend-focused portfolios.
| Key Metric | Value |
|---|---|
| Sector | Technology |
| Dividend yield | 2.40% |
| Current dividend per share | 2.50 USD |
| Dividend history | 14 years |
| Last cut or suspension | None |
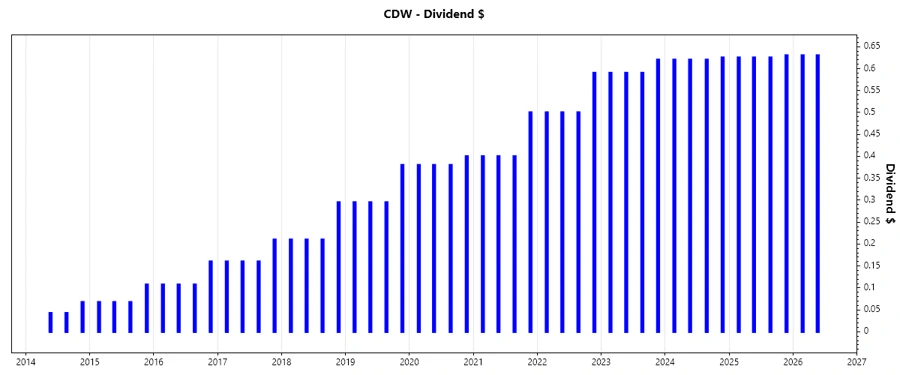
🗣️ Dividend History
The consistency and growth of CDW's dividend payments over the years underscore its commitment to returning capital to shareholders. A stable and progressive dividend history enhances investor confidence and highlights management's focus on shareholder value.
| Year | Dividend per Share (USD) |
|---|---|
| 2026 | 1.26 |
| 2025 | 2.505 |
| 2024 | 2.485 |
| 2023 | 2.39 |
| 2022 | 2.09 |
📈 Dividend Growth
Tracking the dividend growth provides insights into the company’s future payout potential. CDW's 3-year growth at 6.22% and 5-year growth at 10.21% depict a clear trajectory of incremental dividend enhancements, promising potential returns and indicating fiscal prudence.
| Time | Growth |
|---|---|
| 3 years | 6.22% |
| 5 years | 10.21% |
The average dividend growth is 10.21% over 5 years. This shows moderate but steady dividend growth, strengthening CDW’s appeal as a reliable dividend payer.
📉 Payout Ratio
The payout ratio metrics are crucial in understanding the sustainability of dividends against the company’s earnings and cash flow. CDW's EPS-based payout ratio stands at 29.97% while its free cash flow-based ratio is 29.71%, indicating a disciplined approach to balancing shareholder rewards and reinvestment into business operations.
| Key figure | Ratio |
|---|---|
| EPS-based | 29.97% |
| Free cash flow-based | 29.71% |
EPS and FCF payout ratios below 30% reflect robust dividend coverage, enhancing CDW’s capability to uphold its dividend policy.
✅ Cashflow & Capital Efficiency
Evaluation of cash flow and capital efficiency metrics such as free cash flow yield, CAPEX to operating cash flow, and free cash flow/operating cash flow ratio, reveal the company’s efficiency in generating and utilizing cash. These figures are particularly vital for assessing the company’s ability to sustain dividends and operational investments.
| Year | 2023 | 2024 | 2025 |
|---|---|---|---|
| Free Cash Flow Yield | 4.74% | 4.96% | 6.08% |
| Earnings Yield | 3.61% | 4.63% | 5.96% |
| CAPEX to Operating Cash Flow | 9.27% | 9.60% | 9.77% |
| Stock-based Compensation to Revenue | 0.44% | 0.31% | 0.22% |
| Free Cash Flow / Operating Cash Flow Ratio | 90.73% | 90.40% | 90.28% |
The cash flow metrics reflect stable cash generation and efficient capital allocation, which are pivotal in maintaining dividends despite market fluctuations.
🔍 Balance Sheet & Leverage Analysis
A thorough understanding of balance sheet metrics like debt-to-equity, debt-to-assets, and leverage ratios is essential for assessing the company's financial risk and its ability to manage debt levels. These metrics offer insight into the firm’s operational flexibility and financial health.
| Year | 2023 | 2024 | 2025 |
|---|---|---|---|
| Debt-to-Equity | 2.84 | 2.55 | 2.43 |
| Debt-to-Assets | 43.73% | 40.82% | 39.50% |
| Debt-to-Capital | 73.98% | 71.81% | 70.84% |
| Net Debt to EBITDA | 2.68 | 2.85 | 2.93 |
| Current Ratio | 1.23 | 1.35 | 1.18 |
| Quick Ratio | 1.11 | 1.24 | 1.10 |
| Financial Leverage | 6.50 | 6.24 | 6.15 |
The numbers indicate a stable leverage profile and sufficient liquidity to meet CDW’s obligations, thereby ensuring ongoing operational effectiveness.
📈 Fundamental Strength & Profitability
The examination of return and margin metrics, such as return on equity, assets, and profit margins, is essential for evaluating the company's efficiency in generating earnings relative to its expenditure, indicating overall profitability and growth potential.
| Year | 2023 | 2024 | 2025 |
|---|---|---|---|
| Return on Equity | 54.07% | 45.81% | 40.93% |
| Return on Assets | 8.31% | 7.34% | 6.65% |
| Net Margin | 5.17% | 5.13% | 4.76% |
| EBIT Margin | 7.84% | 7.86% | 7.38% |
| EBITDA Margin | 9.11% | 9.16% | 8.70% |
| Gross Margin | 21.76% | 21.92% | 21.73% |
| R&D to Revenue | 0% | 0% | 0% |
With strong margins and returns, CDW exhibits robust profitability, positioning it effectively for sustained growth in revenue and profit generation.
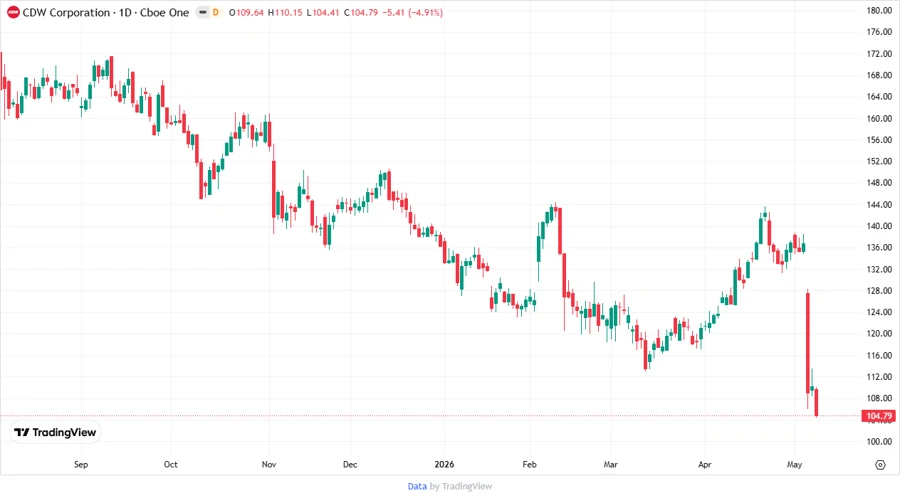
📉 Price Development
Dividend Scoring System
| Category | Score | Score Bar |
|---|---|---|
| Dividend yield | 3 | |
| Dividend Stability | 5 | |
| Dividend growth | 4 | |
| Payout ratio | 4 | |
| Financial stability | 4 | |
| Dividend continuity | 5 | |
| Cashflow Coverage | 4 | |
| Balance Sheet Quality | 4 |
Overall Score: 33/40
Rating
With a solid dividend history, consistent increment patterns, and strong fundamental backing, CDW Corporation is rated as a reliable investment in dividend portfolios. Its disciplined financial approach and commitment to shareholder returns make it a suitable candidate for investors seeking sustainable income growth along with capital preservation.
Smart Data Insight
Master the Perfect Entry & Exit for this Stock
Don't leave your profits to chance. Historically, this stock follows specific seasonal patterns that institutional traders use to maximize returns.
- ✅ Identify the "Golden Buying Window"
- ✅ Avoid high-risk correction cycles
- ✅ Backtested data from the last 20+ years