April 22, 2026 a 07:46 am


CDW: Dividend Analysis - CDW Corporation
CDW Corporation demonstrates a promising dividend profile, characterized by a consistent dividend history over 14 years. Despite a modest dividend yield of 1.04%, the company's steady growth and reasonable payout ratios suggest a sustainable dividend strategy. As CDW continues to maintain financial stability, it represents a reliable dividend-paying stock for investors seeking dependable income.
📊 Overview
CDW Corporation operates within a dynamic sector, reflecting a dividend yield of 1.04%. With a current dividend per share sitting at $2.50, the company showcases a strong commitment to shareholder returns. Over the past 14 years, CDW has upheld its dividend history, underscoring stability. Notably, there has been no recent dividend cut or suspension.
| Metric | Details |
|---|---|
| Sector | Technology |
| Dividend yield | 1.04 % |
| Current dividend per share | 2.50 USD |
| Dividend history | 14 years |
| Last cut or suspension | None |
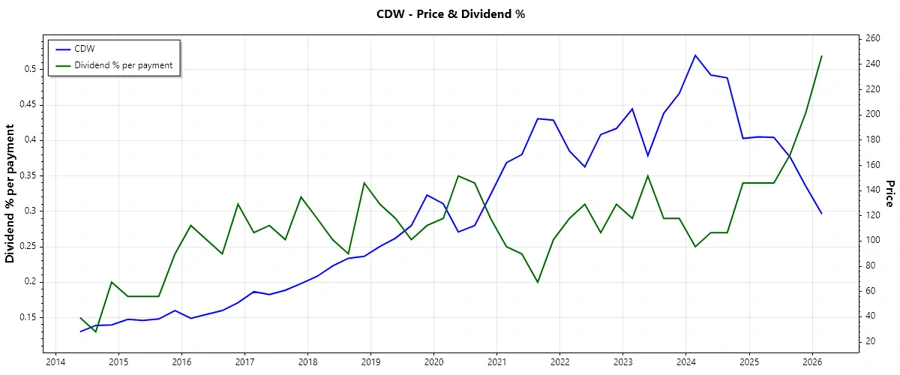
🗣️ Dividend History
The company's dividend history is a testament to its resilience and commitment to delivering shareholder value. The stability over 14 years provides investors with confidence in its management and operational capabilities. Regular dividends signal financial health and profitability.
| Year | Dividend Per Share (USD) |
|---|---|
| 2026 | 0.63 |
| 2025 | 2.505 |
| 2024 | 2.485 |
| 2023 | 2.39 |
| 2022 | 2.09 |
📈 Dividend Growth
Dividend growth reflects the company's ability to enhance shareholder value through increased payments. In the last few years, CDW has maintained a moderate but steady dividend growth, essential in outpacing inflation and increasing returns.
| Time | Growth |
|---|---|
| 3 years | 6.22 % |
| 5 years | 10.22 % |
The average dividend growth is 10.22% over 5 years. This shows moderate but steady dividend growth, enhancing long-term shareholder value.
📉 Payout Ratio
The payout ratio is a crucial measure of dividend sustainability. A lower payout ratio may indicate more room for future payouts, while a higher ratio suggests cautiousness. CDW maintains a responsible balance between paying dividends and retaining earnings for growth.
| Key figure | Ratio |
|---|---|
| EPS-based | 30.50 % |
| Free cash flow-based | 29.67 % |
The EPS-based payout ratio of 30.50% and FCF-based payout ratio of 29.67% suggest a well-managed payout policy, balancing investor returns and capital reinvestment.
✅ Cashflow & Capital Efficiency
Evaluating the cash flow and capital efficiency helps in understanding how effectively a company is utilizing its resources to generate cash. Consistent free cash flow enhances a company's ability to sustain dividends.
| Metric | 2023 | 2024 | 2025 |
|---|---|---|---|
| Free Cash Flow Yield | 4.74% | 4.96% | 6.08% |
| CAPEX to Operating Cash Flow | 9.27% | 9.59% | 9.71% |
| Stock-based Compensation to Revenue | 0.44% | 0.31% | 0% |
| Free Cash Flow / Operating Cash Flow Ratio | 90.73% | 90.40% | 90.28% |
CDW's stable free cash flow yield demonstrates its ability to cover dividends and invest in growth efficiently, while maintaining low CAPEX ratios suggests prudent capital management.
⚠️ Balance Sheet & Leverage Analysis
Analyzing leverage and balance sheet ratios paints a picture of a company's financial structure, risk, and ability to endure economic shifts. CDW's leverage management remains within control, offering stability.
| Ratio | 2023 | 2024 | 2025 |
|---|---|---|---|
| Debt-to-Equity | 2.84 | 2.55 | 2.43 |
| Debt-to-Assets | 43.73% | 40.82% | 39.50% |
| Debt-to-Capital | 73.99% | 71.81% | 70.84% |
| Net Debt to EBITDA | 2.68 | 2.85 | 2.93 |
| Current Ratio | 1.23 | 1.35 | 1.18 |
| Quick Ratio | 1.11 | 1.24 | 1.10 |
| Financial Leverage | 6.50 | 6.24 | 6.15 |
With a decreasing debt-to-equity ratio and stable financial leverage, CDW Corporation remains financially resilient, indicating a low-risk profile.
🔍 Fundamental Strength & Profitability
A focus on fundamental strength and profitability guides long-term growth strategies. Higher returns on equity and assets demonstrate effective management practices.
| Metric | 2023 | 2024 | 2025 |
|---|---|---|---|
| Return on Equity | 54.07% | 45.81% | 40.93% |
| Return on Assets | 8.31% | 7.34% | 6.65% |
| Margins: Net | 5.17% | 5.13% | 4.76% |
| Margins: EBIT | 7.84% | 7.86% | 7.38% |
| Research & Development to Revenue | 0% | 0% | 0% |
CDW's robust return on equity and maintaining margins highlight its efficient operations and competitive positioning in the marketplace.
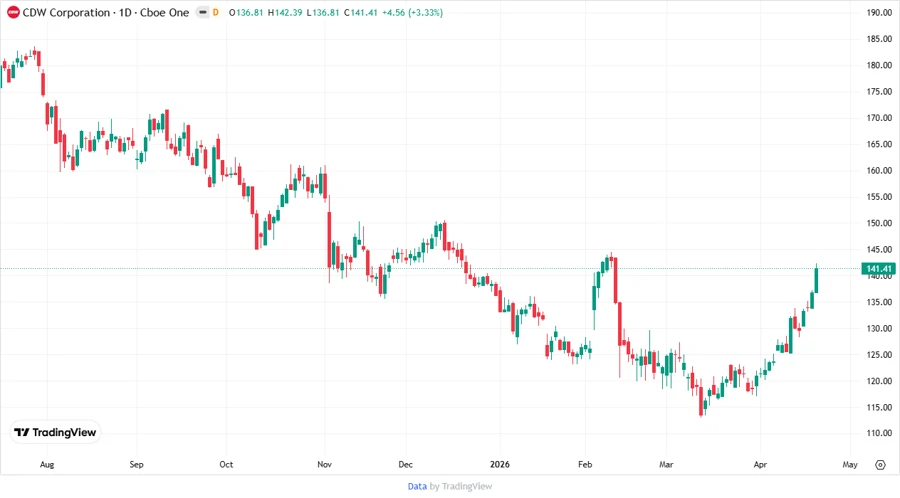
Price Development
📌 Dividend Scoring System
| Category | Score | Score Bar |
|---|---|---|
| Dividend yield | 3 | |
| Dividend Stability | 5 | |
| Dividend growth | 4 | |
| Payout ratio | 4 | |
| Financial stability | 4 | |
| Dividend continuity | 5 | |
| Cashflow Coverage | 4 | |
| Balance Sheet Quality | 4 |
Total Score: 33 out of 40
Rating
CDW Corporation offers a solid dividend profile with consistent growth and stability. Its prudent payout ratios, coupled with strong financials, position it as a reliable dividend investment. We recommend CDW for investors seeking steady income with moderate growth potential.
Smart Data Insight
Master the Perfect Entry & Exit for this Stock
Don't leave your profits to chance. Historically, this stock follows specific seasonal patterns that institutional traders use to maximize returns.
- ✅ Identify the "Golden Buying Window"
- ✅ Avoid high-risk correction cycles
- ✅ Backtested data from the last 20+ years