April 15, 2026 a 03:31 pm

CDW: Dividend Analysis - CDW Corporation
CDW Corporation presents a generous dividend profile with a yield of over 2%, backed by a rich dividend history spanning 14 consecutive years without any recent suspensions or cuts. This showcases a commitment to returning value to its shareholders, reflected in its solid payout ratios and favorable growth prospects. Investors should note that while the dividend yield aligns with industry standards, the consistent increase in dividend per share indicates a stable and reliable income stream. CDW's financial stability and robust cash flows further underscore its capacity to maintain and potentially grow its dividend offerings in the future.
📊 Overview
The following table provides a snapshot of CDW Corporation's significant dividend metrics which paint a picture of its standing in the market currently:
| Metric | Value |
|---|---|
| Sector | Information Technology |
| Dividend Yield | 2.06% |
| Current Dividend Per Share | 2.50 USD |
| Dividend History | 14 years |
| Last Cut or Suspension | None |
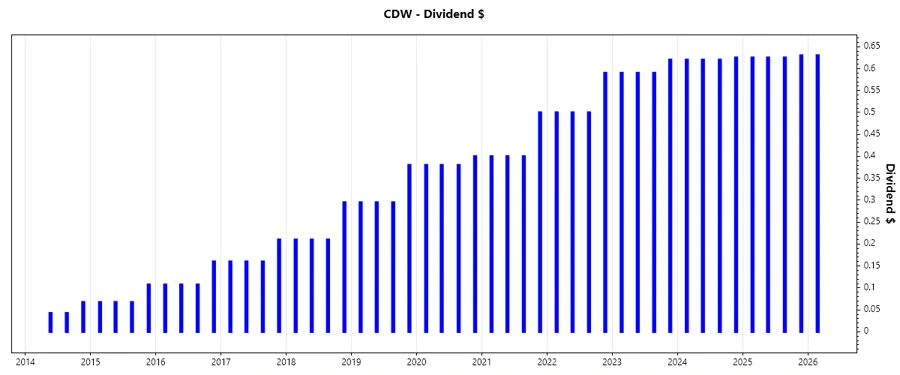
📈 Dividend History
CDW's dividend history reflects its commitment to providing shareholders with steady income and capital returns. The timeline of increasing dividend payments underscores the company's resilience and strategic planning in its financial distribution decisions.
| Year | Dividend per Share (USD) |
|---|---|
| 2026 | 0.63 |
| 2025 | 2.505 |
| 2024 | 2.485 |
| 2023 | 2.39 |
| 2022 | 2.09 |
📈 Dividend Growth
Understanding CDW's dividend growth is critical for long-term investors focusing on compound income growth. Historically, CDW has shown modest, consistent increments in its dividend payout, ensuring a gradual income growth trajectory.
| Time | Growth |
|---|---|
| 3 years | 6.22% |
| 5 years | 10.22% |
The average dividend growth is 10.22% over 5 years. This shows moderate but steady dividend growth, aligning with strategic business stability and shareholder value enhancement goals.
📉 Payout Ratio
The payout ratio serves as a benchmark for assessing the sustainability of CDW's dividend policy. The current payout metrics illustrate a well-managed balance between rewarding shareholders and retaining earnings for further corporate initiatives.
| Key figure ratio | Value |
|---|---|
| EPS-based | 30.50% |
| Free cash flow-based | 29.94% |
The EPS-based payout ratio at 30.50% and the FCF-based payout ratio at 29.94% suggest CDW strategically maintains a conservative dividend distribution approach, balancing both growth reinvestment and shareholder payout.
💰 Cashflow & Capital Efficiency
Assessing CDW's cashflow dynamics and capital efficiency reveals insights into the operational prowess and investment discipline that underpins its dividend policy and return potentials.
| Metric | 2023 | 2024 | 2025 |
|---|---|---|---|
| Free Cash Flow Yield | 6.46% | 4.96% | 6.08% |
| Earnings Yield | 6.35% | 4.63% | 5.96% |
| CAPEX/OCF | 9.72% | 9.60% | 9.72% |
| Stock-based Compensation/Revenue | 0.32% | 0.31% | 0.00% |
| Free Cash Flow / Operating Cash Flow Ratio | 90.28% | 90.40% | 90.28% |
| Return on Invested Capital | 15.13% | 13.13% | 12.13% |
CDW's strong free cash flows reflect efficient capital use, supporting dividend sustainability and profitability alongside its strategic growth initiatives.
🏦 Balance Sheet & Leverage Analysis
The financial leverage and balance sheet ratios underscore CDW's risk profile and financial health, crucial for evaluating the company's ability to sustain its capital commitments, including dividend payouts.
| Metric | 2023 | 2024 | 2025 |
|---|---|---|---|
| Debt-to-Equity | 284.40% | 254.68% | 242.93% |
| Debt-to-Assets | 43.73% | 40.82% | 39.50% |
| Debt-to-Capital | 73.99% | 71.81% | 70.84% |
| Net Debt to EBITDA | 2.68 | 2.85 | 2.93 |
| Current Ratio | 1.23 | 1.35 | 1.18 |
| Quick Ratio | 1.11 | 1.24 | 1.10 |
| Financial Leverage | 6.50 | 6.24 | 6.15 |
With robust leverage figures, CDW showcases a moderate ability to cover its liabilities, maintaining operations and investor confidence.
💼 Fundamental Strength & Profitability
Examining CDW's fundamental performance metrics highlights the company's operational profitability and efficiency in generating shareholder returns.
| Metric | 2023 | 2024 | 2025 |
|---|---|---|---|
| Return on Equity | 54.07% | 45.81% | 40.93% |
| Return on Assets | 8.31% | 7.34% | 6.65% |
| Net Margin | 5.17% | 5.13% | 4.76% |
| EBIT Margin | 7.84% | 7.86% | 7.38% |
| EBITDA Margin | 9.11% | 9.16% | 8.70% |
| Gross Margin | 21.76% | 21.91% | 21.73% |
| R&D to Revenue | 0.00% | 0.00% | 0.00% |
The high return metrics underscore CDW's strong profitability capabilities, reinforcing its position as a lucrative investment with sustainable growth potential.
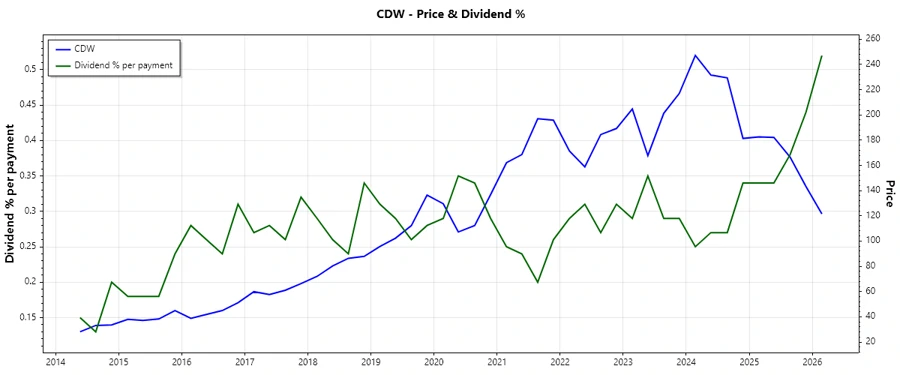
🔍 Price Development
✅ Dividend Scoring System
This scoring system evaluates CDW Corporation across critical dividend-related criteria, assigning a score from 1 to 5 for each category.
| Category | Evaluation | Score |
|---|---|---|
| Dividend yield | Moderate | |
| Dividend Stability | Strong | |
| Dividend growth | Good | |
| Payout ratio | Conservative | |
| Financial stability | Solid | |
| Dividend continuity | Excellent | |
| Cashflow Coverage | Strong | |
| Balance Sheet Quality | Strong |
Total Score: 33/40
🗣️ Rating
CDW Corporation's dividend offering stands out as a solid choice for income-focused investors, given its consistent historical growth and the management's demonstrated capability to sustain payouts. The calculated dividend yield and robust financial metrics further reinforce its position as a reliable investment with a compelling balance of growth and income potential. As such, CDW Corporation receives a positive recommendation for investors prioritizing both security and long-term growth.