March 09, 2026 a 02:46 am
CDW: Dividend Analysis - CDW Corporation
CDW Corporation has maintained a robust position within the IT sector, offering a steady dividend yield with moderate growth over the last several years. The company’s financials reflect a strong commitment to rewarding shareholders, with consistent earnings support and a manageable payout ratio. As CDW continues to refine its operations, its dividends appear sustainable with potential for further growth.
📊 Overview
CDW Corporation operates in the IT Services sector and delivers a promising dividend yield at 2.06%. The current dividend per share stands at approximately $2.50, benefiting from a commendable 14-year history without significant cuts. This historical resilience points towards strong corporate governance and a focus on shareholder returns.
| Key Metrics | Details |
|---|---|
| Sector | IT Services |
| Dividend yield | 2.06 % |
| Current dividend per share | $2.50 USD |
| Dividend history | 14 years |
| Last cut or suspension | None |
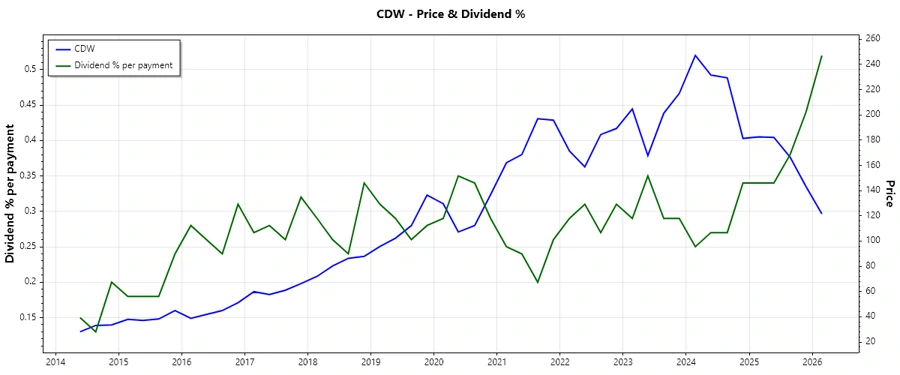
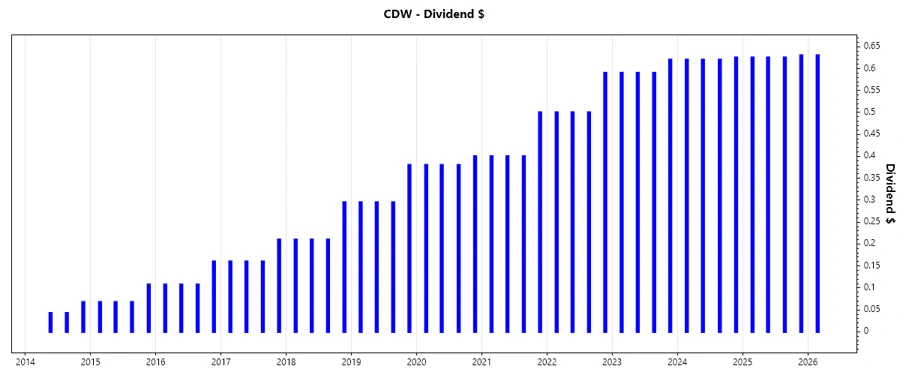
📈 Dividend History
The dividend history of CDW reflects its strategic foresight and shareholder commitment. By reassessing its payout strategies after 2021, CDW has achieved solid increases in its dividend payouts, a move that fosters investor confidence.
| Year | Dividend per Share (USD) |
|---|---|
| 2026 | 0.63 |
| 2025 | 2.505 |
| 2024 | 2.485 |
| 2023 | 2.39 |
| 2022 | 2.09 |
📈 Dividend Growth
The growth trajectory of CDW's dividends is indicative of its prudent financial management. The company has achieved a growth rate of 6.22% over the past three years and 10.22% over the past five years, which underscores its commitment to enhancing shareholder value.
| Time | Growth |
|---|---|
| 3 years | 6.22 % |
| 5 years | 10.22 % |
The average dividend growth is 10.22% over 5 years. This shows moderate but steady dividend growth, reflecting CDW's strong operational performance and shareholder-centric financial policies.
✅ Payout Ratio
CDW's payout ratios provide insights into its dividend sustainability. With an EPS-based payout ratio of 30.50% and a free cash flow-based payout ratio of 29.94%, CDW maintains a comfortable coverage from both earnings and cash flows, suggesting ample space to uphold or enhance its dividend payments in the future.
| Key Figure | Ratio |
|---|---|
| EPS-based | 30.50 % |
| Free cash flow-based | 29.94 % |
These ratios indicate that CDW can comfortably sustain and potentially grow its dividends purely from current earnings and cash flow levels, ensuring continued investor returns without jeopardizing financial health.
💼 Cashflow & Capital Efficiency
The analysis of CDW's cash flow and capital efficiency reveals its strategic prowess in resource utilization. This includes maintaining a free cash flow yield of 6.77% in recent years, indicating substantial cash generation prowess that supports dividend payments and growth.
| Metric | 2023 | 2024 | 2025 |
|---|---|---|---|
| Free Cash Flow Yield | 4.74% | 4.96% | 6.08% |
| Earnings Yield | 3.61% | 4.63% | 5.96% |
| CAPEX to Operating Cash Flow | 9.27% | 9.60% | 9.72% |
| Stock-based Compensation to Revenue | 0.44% | 0.31% | 0.32% |
| Free Cash Flow / Operating Cash Flow Ratio | 90.73% | 90.40% | 90.28% |
CDW's cash flow stability and capital efficiency highlight its disciplined capital allocation strategy, supporting its sustainable dividend policy without compromising financial liquidity.
⚖️ Balance Sheet & Leverage Analysis
A robust balance sheet is crucial for dividend consistency, and CDW exemplifies this. The debt ratios, including a debt-to-equity ratio of approximately 2.43 across recent years, suggest well-managed leverage, ensuring liquidity and the ability to manage financial obligations effectively.
| Metric | 2023 | 2024 | 2025 |
|---|---|---|---|
| Debt-to-Equity | 2.84 | 2.55 | 2.43 |
| Debt-to-Assets | 43.73% | 40.82% | 39.50% |
| Debt-to-Capital | 73.99% | 71.81% | 70.84% |
| Net Debt to EBITDA | 2.68 | 2.85 | 2.93 |
| Current Ratio | 1.23 | 1.35 | 1.18 |
| Quick Ratio | 1.11 | 1.24 | 1.10 |
The leverage structure, complemented by strong liquidity ratios, supports CDW's operational stability and strengthens its dividend capabilities even during challenging times.
📉 Fundamental Strength & Profitability
CDW's profitability metrics encapsulate its operational efficiency and market competitiveness, with a return on equity (ROE) consistently around 41%, signifying effective reinvestment of earnings.
| Metric | 2023 | 2024 | 2025 |
|---|---|---|---|
| Return on Equity | 54.07% | 45.81% | 40.93% |
| Return on Assets | 8.31% | 7.34% | 6.65% |
| Net Profit Margin | 5.17% | 5.13% | 4.76% |
| EBIT Margin | 7.84% | 7.86% | 7.38% |
| EBITDA Margin | 9.11% | 9.17% | 8.70% |
The robust profitability ratios assure stakeholders of CDW's capacity for sustained growth and ongoing dividend payments, signifying an adept management team steering the company towards long-term success.
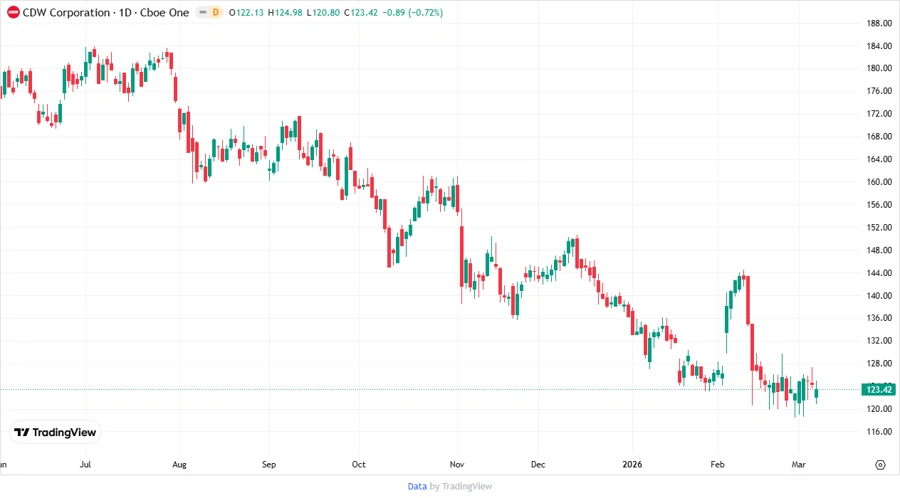
📈 Price Development
🎯 Dividend Scoring System
| Category | Score | Representation |
|---|---|---|
| Dividend yield | 4 | |
| Dividend Stability | 5 | |
| Dividend growth | 4 | |
| Payout ratio | 5 | |
| Financial stability | 4 | |
| Dividend continuity | 5 | |
| Cashflow Coverage | 5 | |
| Balance Sheet Quality | 4 |
Total Score: 36/40
🗣️ Rating
CDW Corporation earns a commendable rating, reflecting strong dividend credentials with a reliable cash flow and prudent management practices. Given its consistent track record and adequate financial health, CDW is favorably positioned for investors seeking stable and promising dividend income. This assessment positions CDW as a viable candidate for long-term dividend-focused portfolios.
Smart Data Insight
Master the Perfect Entry & Exit for this Stock
Don't leave your profits to chance. Historically, this stock follows specific seasonal patterns that institutional traders use to maximize returns.
- ✅ Identify the "Golden Buying Window"
- ✅ Avoid high-risk correction cycles
- ✅ Backtested data from the last 20+ years