July 15, 2025 a 03:31 am


CDW: Dividend Analysis - CDW Corporation
CDW Corporation has been displaying consistent financial strength, marked by a moderate dividend yield and a robust history of dividend payments spanning 13 years. With a sustainable payout ratio based on both EPS and free cash flow, CDW exhibits potential for steady future dividends. However, investors should consider the impact of the moderate growth rates and evaluate the overall market conditions.
Overview 📊
CDW Corporation is positioned in a competitive sector, reflecting a combination of steady income and growth potential. A close analysis of the dividend yield and history demonstrates a commitment to shareholder returns, albeit with room for dividend yield improvement over time.
| Metric | Details |
|---|---|
| Sector | Technology |
| Dividend Yield | 1.71 % |
| Current Dividend Per Share | 2.48 USD |
| Dividend History | 13 years |
| Last Cut or Suspension | None |
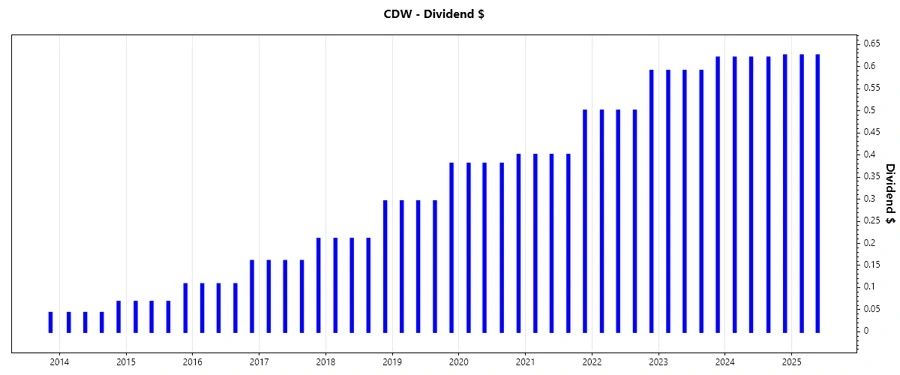
Dividend History 📈
CDW Corporation's dividend history underscores its commitment to returning capital to shareholders through sustained payments. The continuity in dividend payments is a pivotal indicator of the company's financial health and predictable cash flows.
| Year | Dividend Per Share (USD) |
|---|---|
| 2025 | 1.250 |
| 2024 | 2.485 |
| 2023 | 2.39 |
| 2022 | 2.09 |
| 2021 | 1.7 |
Dividend Growth 💹
The growth rate of dividends is a critical factor in assessing the potential for increasing shareholder value. Over the last 3 and 5 years, CDW has shown a slow yet consistent dividend growth, indicating cautious optimism in its capacity to enhance future disbursements.
| Time | Growth |
|---|---|
| 3 years | 13.49 % |
| 5 years | 14.45 % |
The average dividend growth is 14.45 % over 5 years. This shows moderate but steady dividend growth.
Payout Ratio 💼
The payout ratio is a vital measure of dividend sustainability. Evaluating both EPS-based and free cash flow-based payout ratios allows investors to gauge how comfortably these dividends can continue to be paid from earnings and cash flow.
| Key Figure | Ratio |
|---|---|
| EPS-based | 30.27 % |
| Free Cash Flow-based | 32.54 % |
The payout ratios indicate that CDW Corporation maintains a conservative distribution strategy, balancing between EPS and FCF, thereby ensuring continuity in dividend payments without overstretching its financial capacity.
Cashflow & Capital Efficiency 💧
Analyzing cash flow metrics provides insight into the company's operational efficiency and financial health. The free cash flow yield and earnings yield are crucial indicators of the company's capacity to generate cash relative to its valuation, offering information on capital efficiency.
| Year | 2024 | 2023 | 2022 |
|---|---|---|---|
| Free Cash Flow Yield | 4.96 % | 4.74 % | 5.00 % |
| Earnings Yield | 4.63 % | 3.61 % | 4.62 % |
| CAPEX to Operating Cash Flow | 9.60 % | 9.27 % | 9.57 % |
| Stock-based Compensation to Revenue | - | 0.43 % | 0.38 % |
| Free Cash Flow / Operating Cash Flow Ratio | 90.40 % | 90.73 % | 90.43 % |
The consistency in cash flow metrics reflects CDW's strong operational foundation and its ability to sustain capital efficiencies, suggesting a reliable flow of future cash generations.
Balance Sheet & Leverage Analysis 💪
The balance sheet is a testament to the company's financial position. Key leverage ratios provide insights into the amount of debt the company holds relative to its equity and assets, outlining its financial stability and risk profile.
| Year | 2024 | 2023 | 2022 |
|---|---|---|---|
| Debt-to-Equity | 254.68 % | 284.40 % | 380.33 % |
| Debt-to-Assets | 40.82 % | 43.73 % | 46.44 % |
| Debt-to-Capital | 71.81 % | 73.99 % | 79.18 % |
| Net Debt to EBITDA | 2.85 | 2.68 | 2.87 |
| Current Ratio | NN | NN | NN |
| Quick Ratio | 1.24 | 1.11 | 1.17 |
| Financial Leverage | 6.24 | 6.50 | 8.19 |
The leverage ratios indicate a robust balance sheet with modest risk exposure, although attention to the high debt-to-equity ratio is warranted.
Fundamental Strength & Profitability 📊
Fundamental strength and profitability are critical in assessing company's sustainable growth potential. This section examines the margins and return ratios that capture CDW's capacity to generate profits efficiently.
| Year | 2024 | 2023 | 2022 |
|---|---|---|---|
| Return on Equity | 45.81 % | 54.07 % | 69.51 % |
| Return on Assets | 7.34 % | 8.31 % | 8.49 % |
| Net Margin | 5.13 % | 5.17 % | 4.69 % |
| EBIT Margin | 7.86 % | 7.84 % | 7.27 % |
| EBITDA Margin | 9.17 % | 9.12 % | 8.50 % |
| Gross Margin | 21.92 % | 21.76 % | 19.73 % |
| Research & Development to Revenue | 0.00 % | 0.00 % | 0.00 % |
CDW demonstrates solid profitability metrics, though varying margins indicate the need to monitor operational efficiency enhancements.
Price Development ⚖️
Dividend Scoring System 🏆
| Criteria | Score | Score Bar |
|---|---|---|
| Dividend Yield | 3 | |
| Dividend Stability | 4 | |
| Dividend Growth | 3 | |
| Payout Ratio | 4 | |
| Financial Stability | 4 | |
| Dividend Continuity | 4 | |
| Cashflow Coverage | 3 | |
| Balance Sheet Quality | 3 |
Overall Score: 28/40
Rating ⭐
CDW Corporation exhibits a stable dividend profile with a conservative payout strategy and strong financials. The company's moderate yet steady dividend growth showcases its commitment to enhancing shareholder value. Potential investors should consider the robust balance sheet and consistent cash flows, which support future dividend sustainability. While the high debt levels warrant cautious monitoring, the overall indicators suggest a solid long-term investment opportunity for those seeking balanced growth and income.
Smart Data Insight
Master the Perfect Entry & Exit for this Stock
Don't leave your profits to chance. Historically, this stock follows specific seasonal patterns that institutional traders use to maximize returns.
- ✅ Identify the "Golden Buying Window"
- ✅ Avoid high-risk correction cycles
- ✅ Backtested data from the last 20+ years