May 05, 2026 a 08:15 am

CDNS: Trend and Support & Resistance Analysis - Cadence Design Systems, Inc.
Cadence Design Systems, Inc. (CDNS) has shown a resilient performance in the semiconductor software sector, driven by increasing demands in 5G and AI markets. The stock has recently experienced significant price movements that have highlighted both bullish opportunities and critical areas of support. Investors should consider the technical setup as key indicators suggest potential scenarios that could influence future price action.
Trend Analysis
| Date | Close Price | Trend |
|---|---|---|
| 2026-05-04 | 349.51 | ▲ |
| 2026-05-01 | 340.94 | ▲ |
| 2026-04-30 | 329.59 | ▼ |
| 2026-04-29 | 329.95 | ▼ |
| 2026-04-28 | 325.31 | ▼ |
| 2026-04-27 | 336.54 | ▲ |
| 2026-04-24 | 332.89 | ▼ |
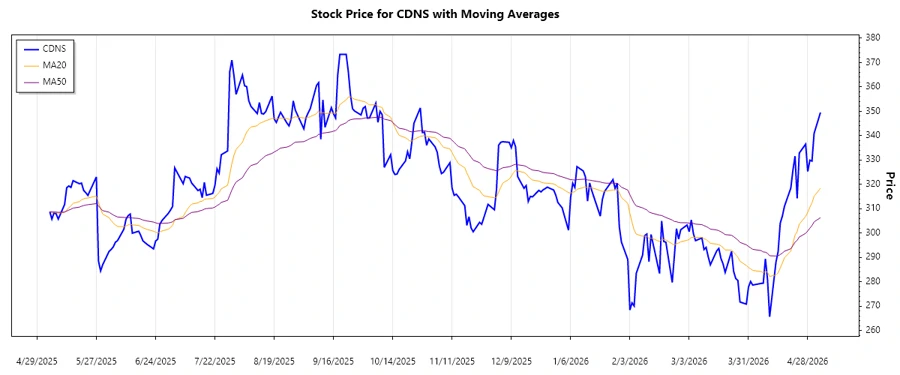
The recent closing prices suggest an overall upward trajectory in the days leading to May 4, 2026. The EMA20 is currently above the EMA50, indicating a bullish trend signal. Investors may view this positively for continuation.
Support and Resistance
| Zone Type | From | To |
|---|---|---|
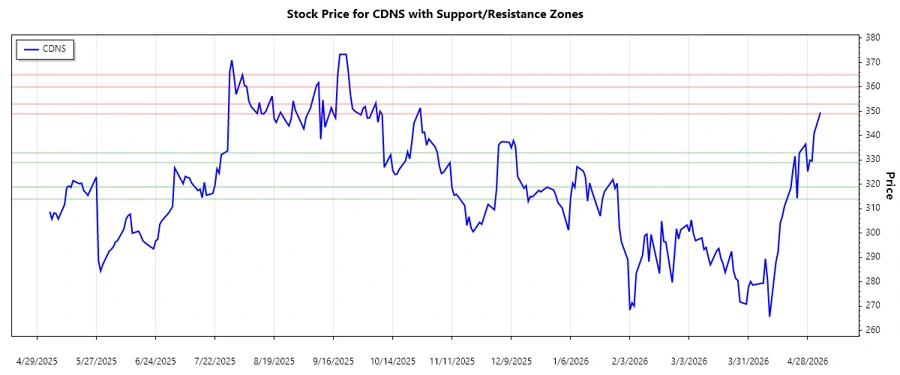
| Support 1 | 329.00 | 333.00 |
| Support 2 | 314.00 | 319.00 |
| Resistance 1 | 349.00 | 353.00 |
| Resistance 2 | 360.00 | 365.00 |
The current closing price places the stock within the first resistance zone. This suggests possible consolidation or a future breakout. Observers should monitor this level for signs of a reversal or continuation.
Conclusion
Cadence Design Systems has shown potential for growth, supported by strong technical indicators. The current market conditions and the company's strategic position in essential growth sectors may drive further price increases. However, investors should be wary of resistance levels that may halt upward momentum, suggesting a need for a cautious approach to entry. Overall, the technical analysis signals a promising outlook, though with inherent market risks.
Smart Data Insight
Master the Perfect Entry & Exit for this Stock
Don't leave your profits to chance. Historically, this stock follows specific seasonal patterns that institutional traders use to maximize returns.
- ✅ Identify the "Golden Buying Window"
- ✅ Avoid high-risk correction cycles
- ✅ Backtested data from the last 20+ years