February 07, 2026 a 09:03 am
CDNS: Trend and Support & Resistance Analysis - Cadence Design Systems, Inc.
Cadence Design Systems, Inc., as a leader in the software and hardware solutions space, shows varied trends in the technical landscape. With fluctuating market segments, it's crucial to understand the prevailing sentiment and levels. Analyzing Cadence's historical pricing patterns may provide insight into potential strategic opportunities for investors looking to capitalize on industry dynamics.
Trend Analysis
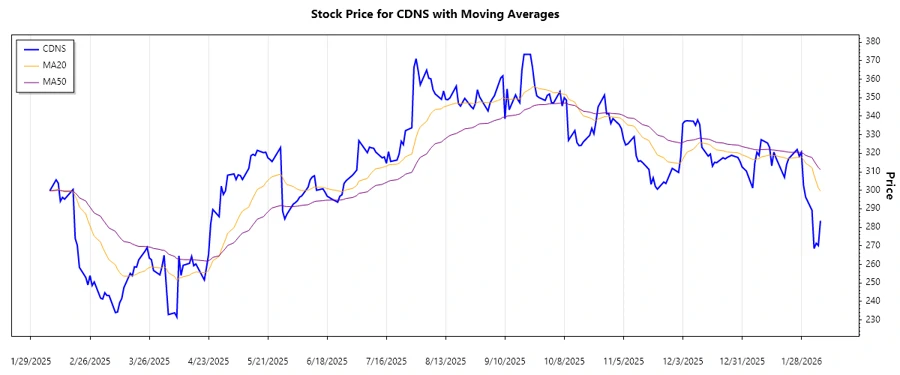
An analysis of Cadence Design Systems, Inc. stock indicates fluctuating trends over recent months. Calculating the exponential moving average (EMA) over 20 and 50 periods provides clarity on the current trend direction.
Using the latest stock data, the EMA20 and EMA50 were computed, and the results indicate a ▼ downward trend based on the fact that EMA20 < EMA50.
| Date | Close Price | Trend |
|---|---|---|
| 2026-02-06 | 283.52 | 🔴▼ |
| 2026-02-05 | 270.14 | 🔴▼ |
| 2026-02-04 | 271.42 | 🔴▼ |
| 2026-02-03 | 268.50 | 🔴▼ |
| 2026-02-02 | 289.19 | 🔴▼ |
| 2026-01-30 | 296.36 | 🔴▼ |
| 2026-01-29 | 302.67 | 🔴▼ |
In conclusion, the technical indicators suggest caution, as the downward trend highlights potential continued declines in stock price.
Support and Resistance
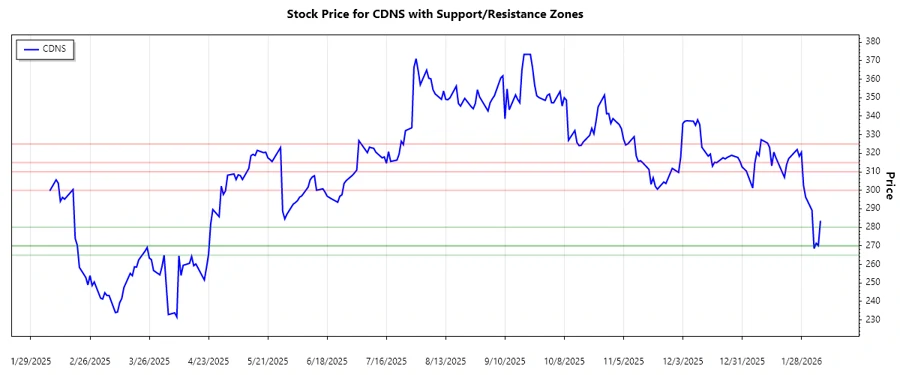
Identifying support and resistance zones can help predict potential price movements for Cadence Design Systems, Inc., offering clear entries and exits for traders.
| Type | Zone Start | Zone End | |
|---|---|---|---|
| Support 1 | 270.00 | 280.00 | 🔵▲ |
| Support 2 | 265.00 | 270.00 | 🔵▲ |
| Resistance 1 | 300.00 | 310.00 | 🔴▼ |
| Resistance 2 | 315.00 | 325.00 | 🔴▼ |
Currently, the price remains in the first support zone. This may suggest stronger buying interest, potentially stabilizing the price within this range.
Conclusion
The overview indicates a bearish trend for Cadence Design Systems, Inc. This current setting may continue unless significant technical levels are breached, releasing potential upside momentum. Market participants should remain vigilant and flexible, evaluating external economic factors which could influence the stock price drastically. While support levels provide confidence for a potential bounce, resistance points pose challenges to extended rallies. Portfolio managers and traders should keep these trading zones and moving averages as touchstones for upcoming strategy adjustments.