
June 25, 2026 a 11:43 am
CDNS: Fundamental Ratio Analysis - Cadence Design Systems, Inc.
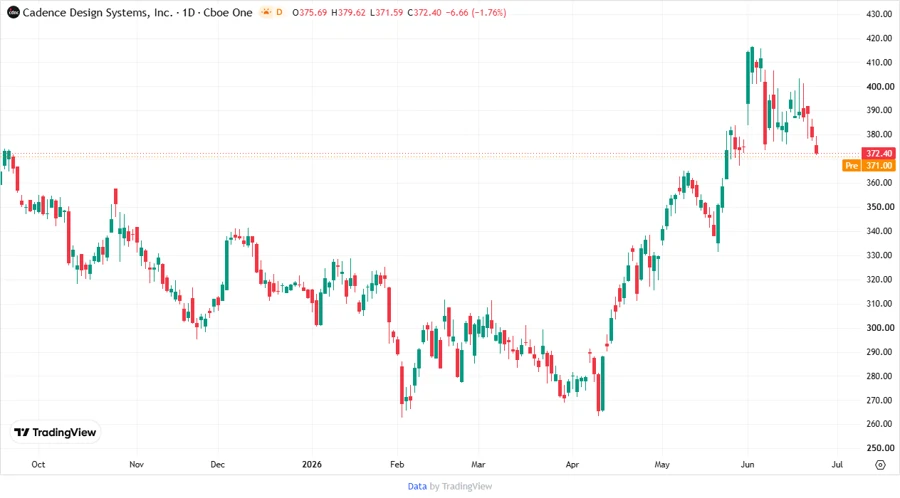
Cadence Design Systems, Inc., with its extensive suite of design software and services, caters to various tech industries globally. Despite facing competition, its diversified applications in 5G, automotive, healthcare, and more indicates solid growth potential. The stock displays promising fundamentals and analyst optimism toward future performance levels.
Fundamental Rating
Cadence's fundamental metrics denote stability and steady growth across various financial ratios.
| Metric | Score | |
|---|---|---|
| Overall | 3 | |
| Discounted Cash Flow | 3 | |
| Return on Equity | 4 | |
| Return on Assets | 5 | |
| Debt to Equity | 2 | |
| Price to Earnings | 1 | |
| Price to Book | 1 |
Historical Rating
Review the evolution of Cadence’s scores for further insight into its financial history and trends.
| Date | Overall | DCF | ROE | ROA | Debt/Equity | P/E | P/B |
|---|---|---|---|---|---|---|---|
| 2026-06-24 | 3 | 3 | 4 | 5 | 2 | 1 | 1 |
| - | 0 | 3 | 4 | 5 | 2 | 1 | 1 |
Analysts Price Targets
Analysts have high expectations for Cadence's price movement, reflecting investor confidence.
| High | Low | Median | Consensus |
|---|---|---|---|
| $440 | $370 | $425 | $412.83 |
Analysts Sentiment
Current sentiments provide a comprehensive perspective when considering investment in Cadence.
| Recommendation | Count | |
|---|---|---|
| Strong Buy | 0 | |
| Buy | 26 | |
| Hold | 4 | |
| Sell | 1 | |
| Strong Sell | 0 |
Conclusion
Cadence Design Systems, Inc. presents strong investment potential with its robust technological offerings in multiple sectors. The company maintains stable fundamentals and inspiring growth projections. Analysts generally maintain a positive outlook, reflecting trust in its financial strategy and market leadership. While challenges exist within the competitive tech field, Cadence's innovative solutions and diversified portfolio grant it strategic advantages. Investors should weigh its historical performance against the backdrop of broader economic trends before deciding.
Smart Data Insight
Master the Perfect Entry & Exit for this Stock
Don't leave your profits to chance. Historically, this stock follows specific seasonal patterns that institutional traders use to maximize returns.
- ✅ Identify the "Golden Buying Window"
- ✅ Avoid high-risk correction cycles
- ✅ Backtested data from the last 20+ years