
July 02, 2026 a 10:15 am
CDNS: Fibonacci Analysis - Cadence Design Systems, Inc.
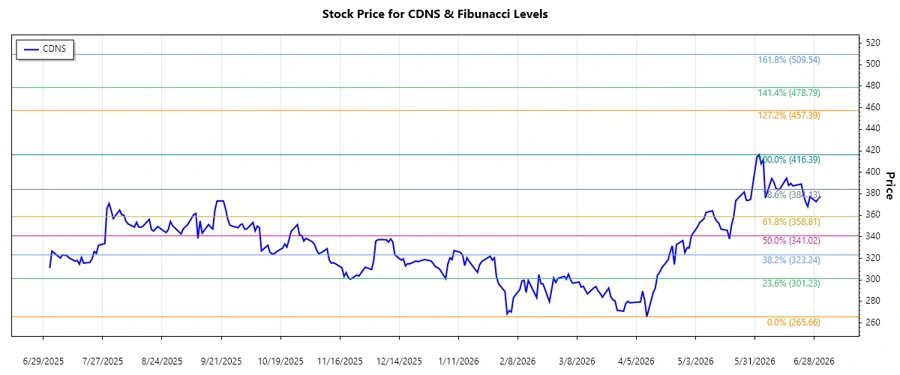
Cadence Design Systems, Inc. (CDNS) has shown robust performance across multiple sectors, driven by its comprehensive product suite and specialized offerings. With a diverse clientele in industries such as automotive and hyperscale computing, the stock has been experiencing a substantial trend lately. Analysts are closely watching its next moves, especially the implications of recent price changes on its valuation and future trajectory.
Fibonacci Analysis
| Trend Start Date | Trend End Date | High Price Date | High Price | Low Price Date | Low Price | Retracement Levels |
|---|---|---|---|---|---|---|
| 2026-02-24 | 2026-06-22 | 2026-06-02 | 416.39 | 2026-04-10 | 265.66 |
|
The current price is not in any retracement zone and is showing upward momentum above the 0.236 level, suggesting an ongoing uptrend. This level can act as a support in case of a pullback.
Conclusion
The recent upward trend in CDNS stock is promising, reflecting positively on the company's substantial technological advancements and broad market presence. However, considering market volatility, there's a potential risk for correction, though the analyzed Fibonacci levels provide insight into key areas of support. Overall, while CDNS remains in an encouraging position, further analysis is essential for informed investment decisions based on current market dynamics.
Smart Data Insight
Master the Perfect Entry & Exit for this Stock
Don't leave your profits to chance. Historically, this stock follows specific seasonal patterns that institutional traders use to maximize returns.
- ✅ Identify the "Golden Buying Window"
- ✅ Avoid high-risk correction cycles
- ✅ Backtested data from the last 20+ years