April 30, 2026 a 03:30 am

CCL: Dividend Analysis - Carnival Corporation & plc
The following analysis provides an in-depth look at the dividend profile for Carnival Corporation & plc. Despite a long history of dividend payouts, the company has currently suspended its dividend, signaling changes in financial strategy. Key metrics and financial fundamentals are reviewed to assess investment risks and opportunities.
📊 Overview
The analysis of Carnival Corporation & plc offers insight into the sustainability and growth prospects of its dividend profile. The metrics highlight a previously robust dividend history amidst recent strategic shifts.
| Metric | Value |
|---|---|
| Sector | Consumer Cyclical |
| Dividend yield | 0.47% |
| Current dividend per share | $0 USD |
| Dividend history | 33 years |
| Last cut or suspension | None |
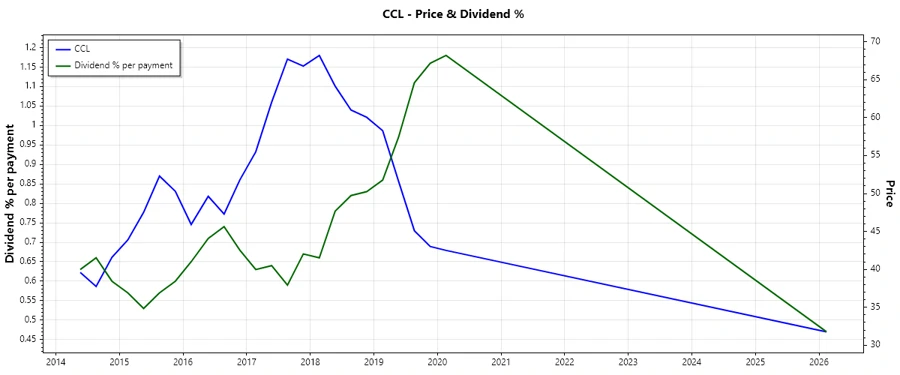
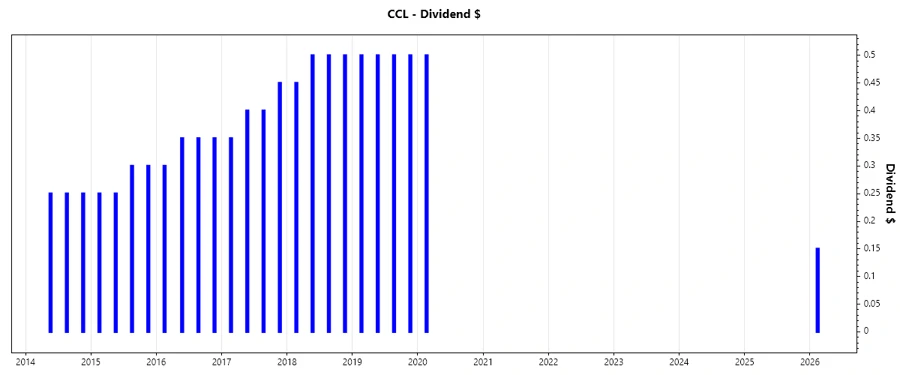
🗣️ Dividend History
Understanding a company's dividend history is crucial for gauging its commitment to returning value to shareholders and its resilience through economic cycles. Carnival's history reflects a longstanding practice of dividend payments, though recently challenged.
| Year | Dividend per Share |
|---|---|
| 2026 | $0.15 |
| 2020 | $0.50 |
| 2019 | $2.00 |
| 2018 | $1.95 |
| 2017 | $1.60 |
📈 Dividend Growth
Dividend growth indicates a company's financial health and its ability to increase shareholder returns. However, Carnival shows no growth in this area for both the 3-year and 5-year periods, raising concerns.
| Time | Growth |
|---|---|
| 3 years | 0% |
| 5 years | 0% |
The average dividend growth is 0% over 5 years. This shows modest growth and underscores potential financial pressures.
✅ Payout Ratio
The payout ratio is a key indicator of a company's ability to sustain its dividend. With current EPS and FCF payout ratios at 0%, there are no distributions from earnings or cash flows.
| Key Figure | Ratio |
|---|---|
| EPS-based | 0% |
| Free cash flow-based | 0% |
This reflects a conservatively managed payout strategy, prioritizing reinvestment over distributions in recent fiscal periods.
📉 Cashflow & Capital Efficiency
An analysis of cashflows supports insights on operational efficiency and management priorities, affecting dividend potential. The metrics reflect variable capital efficiency, impacted by strategic adjustments.
| Year | 2025 | 2024 | 2023 |
|---|---|---|---|
| Free Cash Flow Yield | 7.66% | 4.00% | 5.25% |
| Earnings Yield | 8.11% | 5.91% | -0.39% |
| CAPEX to Operating Cash Flow | 54.45% | 78.10% | 76.71% |
| Stock-based Compensation to Revenue | 0.40% | 0.25% | 0.25% |
| Free Cash Flow / Operating Cash Flow Ratio | 41.93% | 21.90% | 23.29% |
The data suggest mixed cash flow stability, warranting cautious optimism about sustainable capital efficiency.
🏦 Balance Sheet & Leverage Analysis
Balance sheet strength is essential for dividend evaluations, reflecting debt management and financial resilience.
| Year | 2025 | 2024 | 2023 |
|---|---|---|---|
| Debt-to-Equity | 2.28 | 3.12 | 4.63 |
| Debt-to-Assets | 54.16% | 58.86% | 64.92% |
| Net Debt to EBITDA | 3.77 | 4.44 | 6.74 |
| Current Ratio | 0.32 | 0.29 | 0.46 |
| Quick Ratio | 0.28 | 0.25 | 0.41 |
The analysis shows moderate leverage levels but challenges in liquidity, implying careful evaluation of financial stability is needed.
📊 Fundamental Strength & Profitability
Evaluating Carnival Corporation's profitability indicates its ability to generate returns and competitiveness.
| Year | 2025 | 2024 | 2023 |
|---|---|---|---|
| Return on Equity | 22.47% | 20.71% | -1.08% |
| Net Margin | 10.37% | 7.66% | -0.34% |
| Gross Margin | 29.62% | 37.50% | 33.70% |
| Research & Development to Revenue | 0% | 0% | 0% |
Profitability metrics suggest recovery potential but highlight past losses indicating a need for ongoing strategic improvements.
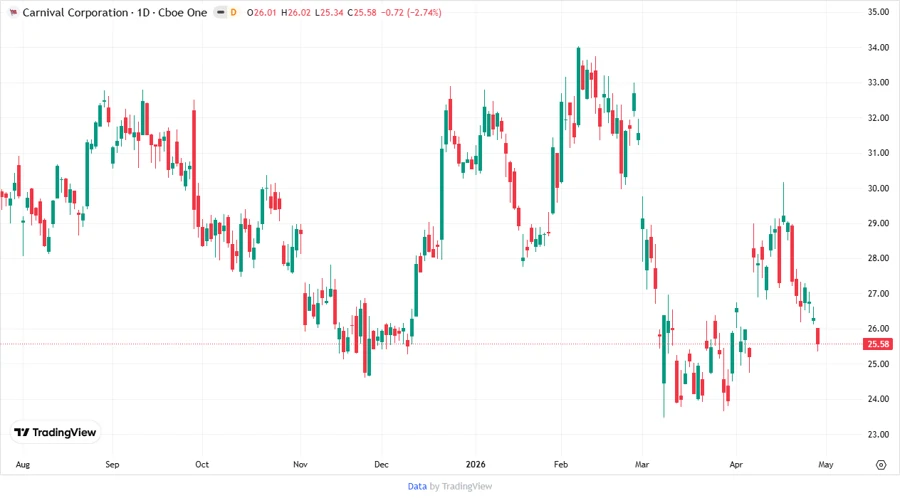
📈 Price Development
💹 Dividend Scoring System
| Category | Score | Score Bar |
|---|---|---|
| Dividend yield | 1 | |
| Dividend stability | 2 | |
| Dividend growth | 1 | |
| Payout ratio | 3 | |
| Financial stability | 3 | |
| Dividend continuity | 2 | |
| Cashflow Coverage | 3 | |
| Balance Sheet Quality | 2 |
Total Score: 17/40
🛡️ Rating
Based on the current analysis, Carnival Corporation & plc presents a cautious investment outlook. The suspension of dividends and moderate financial stability metrics suggest review and monitoring of strategic developments. The company needs ongoing cash flow improvements and potential debt restructuring to regain its financial robust standing and reinstate dividends.