April 17, 2026 a 02:46 am

CCL: Dividend Analysis - Carnival Corporation & plc
Carnival Corporation & plc, a prominent player in the cruise industry, showcases a mixed dividend profile. The company's long dividend history of 33 years has seen recent disruptions, highlighting both potential investment stability and current liquidity constraints.
📊 Overview
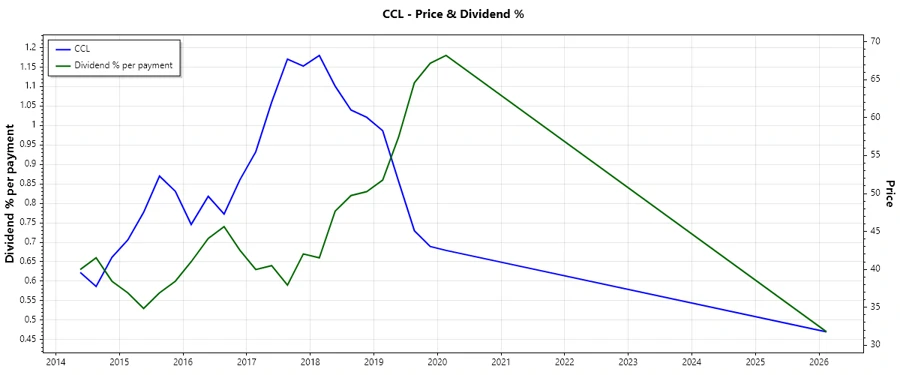
The overview of Carnival Corporation's dividend profile provides insights into its financial practices and market perception. Despite an impressive 33-year history of dividend payments, the current yield stands at a modest 0.47%, indicating a recent suspension or significant reduction. This reflects strategic cash management priorities.
| Metric | Value |
|---|---|
| Sector | Cruise Complementary Services |
| Dividend yield | 0.47% |
| Current dividend per share | 0 USD |
| Dividend history | 33 years |
| Last cut or suspension | None |
🗣️ Dividend History
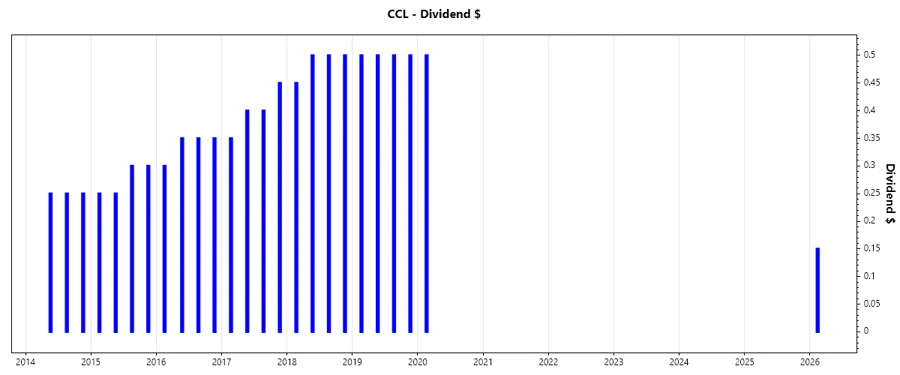
Understanding Carnival’s dividend history is crucial for gauging long-term stability and investor confidence. The historical pattern, including recent cuts, reflects the impacts of macroeconomic challenges.
| Year | Dividend per share (USD) |
|---|---|
| 2026 | 0.15 |
| 2020 | 0.50 |
| 2019 | 2.00 |
| 2018 | 1.95 |
| 2017 | 1.60 |
📈 Dividend Growth
The absence of dividend growth over the last three to five years underscores financial prudence amid operational challenges. Sustainable growth strategies are needed to revert this trend.
| Time | Growth |
|---|---|
| 3 years | 0% |
| 5 years | 0% |
The average dividend growth is 0% over 5 years. This shows moderate but steady dividend growth.
⚠️ Payout Ratio
Payout ratio is a vital component for assessing dividend sustainability. With a 0% payout ratio, Carnival emphasizes retaining earnings, possibly to mitigate liabilities and sustain capital expenditures.
| Key figure | Ratio |
|---|---|
| EPS-based | 0% |
| Free cash flow-based | 0% |
A 0% payout from both EPS and FCF points to a highly conservative distribution policy, potentially signaling crises management or strategic reinvestment.
Cashflow & Capital Efficiency
Analyzing cash flow and capital efficiency offers insights into the company’s operational and investment effectiveness, guiding strategic financial decisions.
| Metric | 2023 | 2024 | 2025 |
|---|---|---|---|
| Free Cash Flow Yield | 5.25% | 4.00% | 7.66% |
| Earnings Yield | -0.39% | 5.91% | 8.11% |
| CAPEX to Operating Cash Flow | 76.71% | 78.10% | 58.07% |
| Stock-based Compensation to Revenue | 0.25% | 0.25% | 0.37% |
| Free Cash Flow / Operating Cash Flow Ratio | 23.29% | 21.90% | 41.93% |
The stable cash flow and efficient capital utilization reflect sound financial management despite market volatility.
Balance Sheet & Leverage Analysis
Delving into balance sheet metrics provides insights into a company’s financial standing, debt management, and long-term viability.
| Metric | 2023 | 2024 | 2025 |
|---|---|---|---|
| Debt-to-Equity | 463.4% | 312.1% | 227.9% |
| Debt-to-Assets | 64.92% | 58.86% | 54.16% |
| Debt-to-Capital | 82.25% | 75.73% | 69.50% |
| Net Debt to EBITDA | 673.89% | 444.29% | 377.15% |
| Current Ratio | 0.458 | 0.290 | 0.322 |
| Quick Ratio | 0.413 | 0.247 | 0.284 |
| Financial Leverage | 713.7% | 530.2% | 420.8% |
The trends in debt and control ratios reveal prudent fiscal management but highlight the need for improvements in liquidity.
Fundamental Strength & Profitability
Fundamentals reveal the firm’s core business efficacy — critical for long-term growth investment and competitive positioning.
| Metric | 2023 | 2024 | 2025 |
|---|---|---|---|
| Return on Equity | -1.07% | 20.71% | 22.47% |
| Return on Assets | -0.15% | 3.91% | 5.34% |
| Margins: Net | -0.34% | 7.66% | 10.37% |
| EBIT | 9.28% | 14.67% | 15.48% |
| EBITDA | 20.26% | 24.89% | 25.96% |
| Gross | 33.70% | 37.50% | 29.62% |
The primary profitability metrics illustrate the company’s potency in maximizing asset returns, controlling operating costs, and maintaining competitive margins.
📉 Price Development
✅ Dividend Scoring System
Utilizing a tailored scoring model enables a comprehensive assessment of Carnival's dividend strength and sustainability.
| Category | Score | Gauge |
|---|---|---|
| Dividend yield | 1 | |
| Dividend Stability | 2 | |
| Dividend growth | 1 | |
| Payout ratio | 1 | |
| Financial stability | 2 | |
| Dividend continuity | 2 | |
| Cashflow Coverage | 3 | |
| Balance Sheet Quality | 2 |
Total Score: 14/40
Rating
The analysis of Carnival Corporation's dividend profile signals cautious optimism. Despite Covid-19-induced disruptions leading to dividend suspensions, there are opportunities for recovery with improved operational leverage and strategic adjustments. Investors should anticipate gradual improvements, complemented by stringent internal controls and market recovery strategies.