March 21, 2026 a 07:46 am

CCL: Dividend Analysis - Carnival Corporation & plc
The dividend profile of Carnival Corporation & plc presents a complex scenario for investors. With a long history of 33 years of dividend payments, the recent years have seen a pause in payouts due to strategic decisions made by the company. Given its modest dividend yield and currently suspended dividend policy, investors need to evaluate the potential for future reinstatement of dividends within the context of the overall financial stability and growth objectives of the company.
📊 Overview
Carnival Corporation & plc operates in the consumer discretionary sector, focusing primarily on the cruise line industry. The company's financial strategies have recently included the suspension of dividends, with the last dividend payment recorded 33 years ago. While this decision impacts short-term income investors, it's crucial for stakeholders to assess the long-term growth trajectory and potential resumption of dividends.
| Metric | Value |
|---|---|
| Sector | Consumer Discretionary |
| Dividend Yield | 0.47% |
| Current Dividend per Share | $0.00 |
| Dividend History | 33 years |
| Last Cut or Suspension | None |
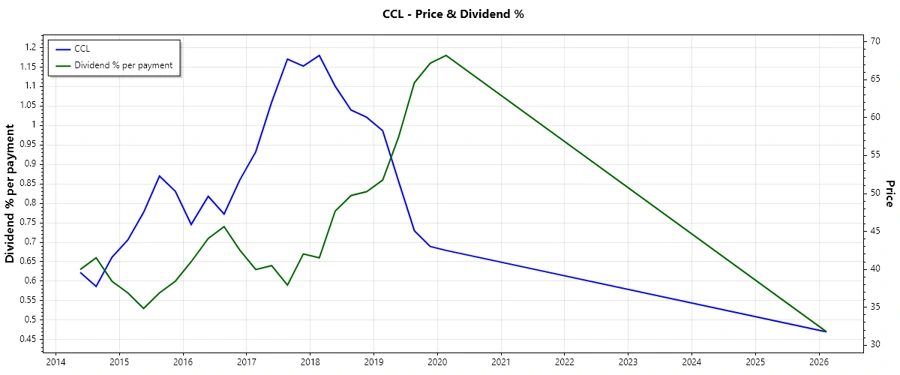
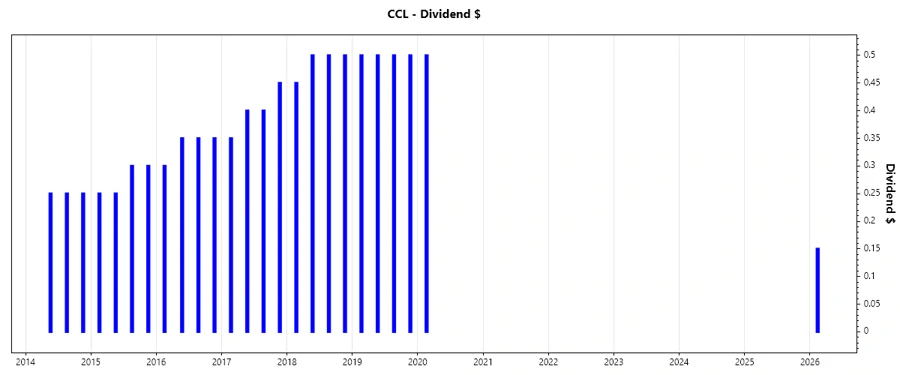
📉 Dividend History
The dividend history of Carnival Corporation & plc illustrates the company's long-standing commitment to returning value to shareholders. However, strategic financial management during challenging periods has led to a pause in dividends. Understanding the historical dividend trends is crucial for gauging potential future policies.
| Year | Dividend per Share |
|---|---|
| 2026 | $0.15 |
| 2020 | $0.50 |
| 2019 | $2.00 |
| 2018 | $1.95 |
| 2017 | $1.60 |
📈 Dividend Growth
The stagnation in dividend growth for Carnival Corporation & plc highlights a period of financial recalibration. The lack of recent growth underscores a focus on strategic reinvestment and financial stabilization.
| Time | Growth |
|---|---|
| 3 years | 0% |
| 5 years | 0% |
The average dividend growth is 0% over 5 years. This shows a halt in dividend increases, likely reflecting broader financial strategies and market conditions.
✅ Payout Ratio
The payout ratio is a critical measure of a company's ability to sustain its dividend payments without compromising financial health. For Carnival, both EPS-based and free cash flow-based payout ratios stand at 0%, reflecting the current suspension of dividends.
| Key Figure | Ratio |
|---|---|
| EPS-based | 0% |
| Free cash flow-based | 0% |
This indicates cautious financial management, prioritizing reinvestment and capital preservation over immediate shareholder payouts.
💸 Cashflow & Capital Efficiency
Cash flow management is pivotal in evaluating a company's financial resilience and operational efficiency. Carnival's free cash flow yield and earnings yield, alongside its capital efficiency measures, provide insights into its operational robustness and adaptability.
| Metric | 2025 | 2024 | 2023 |
|---|---|---|---|
| Free Cash Flow Yield | 7.86% | 4.00% | 5.25% |
| Earnings Yield | 8.11% | 5.91% | -0.39% |
| CAPEX to Operating Cash Flow | 58.07% | 78.10% | 76.71% |
| Stock-based Compensation to Revenue | 0.37% | 0.25% | 0.25% |
| Free Cash Flow / Operating Cash Flow Ratio | 41.93% | 21.90% | 23.29% |
The efficiency and stability in cash flows highlight a focus on strategic expenditure and capital management to support long-term growth strategies.
🔗 Balance Sheet & Leverage Analysis
Carnival Corporation's leverage ratios and liquidity metrics are critical indicators of its financial health, informing stakeholders of potential risks and stability.
| Metric | 2025 | 2024 | 2023 |
|---|---|---|---|
| Debt-to-Equity | 227.88% | 312.10% | 463.40% |
| Debt-to-Assets | 54.16% | 58.86% | 64.92% |
| Debt-to-Capital | 69.50% | 75.73% | 82.25% |
| Net Debt to EBITDA | 3.78 | 4.44 | 6.74 |
| Current Ratio | 32.23% | 29.08% | 45.87% |
| Quick Ratio | 28.37% | 24.71% | 41.27% |
| Financial Leverage | 4.21 | 5.30 | 7.14 |
The elevated debt metrics signify potential risks, but must be weighed against the company's strategic growth initiatives and financing structures.
📊 Fundamental Strength & Profitability
Key profitability ratios reflect Carnival Corporation's ability to generate returns relative to its assets and equity, offering insight into operational efficiency and strategic competitiveness.
| Metric | 2025 | 2024 | 2023 |
|---|---|---|---|
| Return on Equity | 22.47% | 20.71% | -1.07% |
| Return on Assets | 5.34% | 3.91% | -0.15% |
| Margins: Net | 10.36% | 7.66% | -0.34% |
| Margins: EBIT | 15.48% | 14.67% | 9.28% |
| Margins: EBITDA | 25.96% | 24.89% | 20.26% |
| Margins: Gross | 29.62% | 37.50% | 33.70% |
| Research & Development / Revenue | 0.00% | 0.00% | 0.00% |
The return metrics indicate a company's reinvigoration capabilities, necessary for competitive positioning in a recovering market.
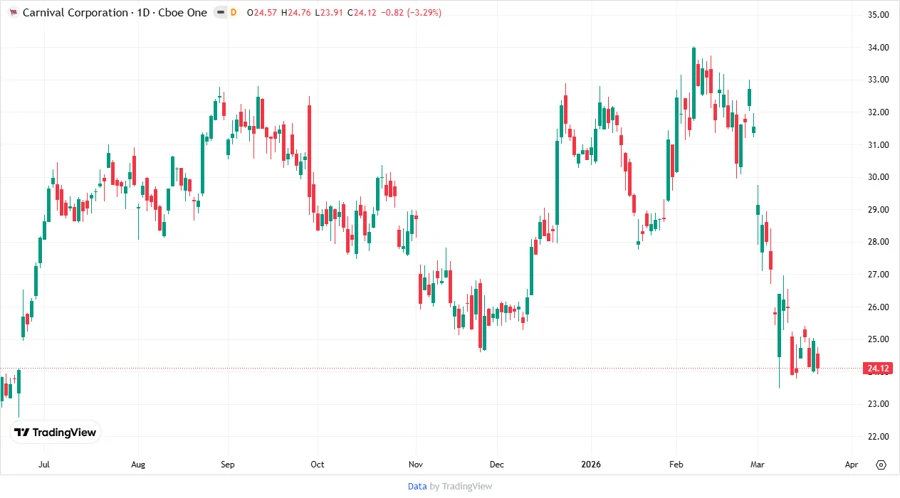
📈 Price Development
🏆 Dividend Scoring System
| Criteria | Score | Rating |
|---|---|---|
| Dividend Yield | 1 | |
| Dividend Stability | 2 | |
| Dividend Growth | 1 | |
| Payout Ratio | 2 | |
| Financial Stability | 3 | |
| Dividend Continuity | 3 | |
| Cashflow Coverage | 2 | |
| Balance Sheet Quality | 2 |
Total Score: 16/40
⭐ Rating
Carnival Corporation & plc's dividend profile, amidst modest short-term financial challenges, invites caution and strategic evaluation for prospective investors. The company's enduring market presence and potential for reinstating dividends warrant a watchful approach, balancing immediate financial metrics against future growth opportunities and market recoveries.
Smart Data Insight
Master the Perfect Entry & Exit for this Stock
Don't leave your profits to chance. Historically, this stock follows specific seasonal patterns that institutional traders use to maximize returns.
- ✅ Identify the "Golden Buying Window"
- ✅ Avoid high-risk correction cycles
- ✅ Backtested data from the last 20+ years