January 08, 2026 a 07:46 am

CCL: Dividend Analysis - Carnival Corporation & plc
Carnival Corporation & plc is currently navigating waters without dividends. Despite its historical capability of sustaining dividends for 33 years, recent financial turbulence, likely linked to global events drastically impacting the travel industry, has led to halting its once consistent payouts. Investors should cautiously consider its financial restructuring and cash flow management strategies moving forward.
Overview 📊
| Sector | Dividend Yield | Current Dividend per Share | Dividend History | Last Cut or Suspension |
|---|---|---|---|---|
| Consumer Discretionary | 0 % | 0 USD | 33 years | None |
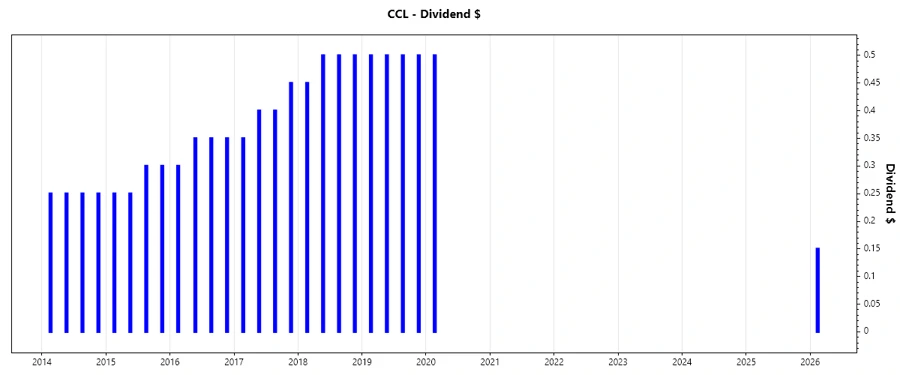
Dividend History 📜
Historically, Carnival Corporation & plc has showcased robust dividend payments for over three decades. Such consistency signifies a strong commitment to returning capital to shareholders. This dividend strategy has been a pillar for shareholder value, making it crucial for long-term confidence and the protective fortification of investor trust.
| Year | Dividend per Share (USD) |
|---|---|
| 2026 | 0.15 |
| 2020 | 0.50 |
| 2019 | 2.00 |
| 2018 | 1.95 |
| 2017 | 1.60 |
Dividend Growth 📈
Despite recent setbacks, historical data demonstrate Carnival Corporation's capacity for moderate value growth for shareholders, thanks to its dividend policy. It's vital for potential investors to monitor signs of recovery in this dividend strategy.
| Time | Growth |
|---|---|
| 3 years | 0 % |
| 5 years | 0 % |
The average dividend growth is 0 % over 5 years. This shows moderate but steady dividend growth.
Payout Ratio 💰
The payout ratios give essential insights into the sustainability of dividend payments. Unlike past performance, current EPS and free cash flow payout ratios are at unsustainable levels, indicating financial constraints that require prudent management and strategic decisions.
| Key figure | Ratio |
|---|---|
| EPS-based | 0 % |
| Free cash flow-based | 0 % |
Given the current economic climate, the 0 % (EPS) and 0 % (FCF) payout ratios indicate a need for internal buffer buildup rather than outward distributions.
Cashflow & Capital Efficiency 💼
A deeper dive into cash flow reveals significant influence on the company's capital strategy and operating liquidity. The following efficiencies spotlight operational resilience, even when dividend disbursements disappear from schedules.
| 2023 | 2024 | 2025 | |
|---|---|---|---|
| Free Cash Flow Yield | 5.25% | 4.00% | 0% |
| Earnings Yield | -0.39% | 5.91% | 8.11% |
| CAPEX to Operating Cash Flow | 76.71% | 78.10% | 0% |
| Stock-based Compensation to Revenue | 0.25% | 0.25% | 0% |
The cash flow analysis illustrates how essential financial reform can be managed despite low dividend output, keeping capital efficiency intact.
Balance Sheet & Leverage Analysis 📊
Analyzing leverage ratios is pivotal to understand the company's debt reliance and its implications on liquidity and capital structure, ultimately affecting dividend decisions.
| 2023 | 2024 | 2025 | |
|---|---|---|---|
| Debt-to-Equity | 463.40% | 312.10% | 0% |
| Debt-to-Assets | 64.92% | 58.86% | 0% |
| Debt-to-Capital | 82.25% | 75.73% | 0% |
| Net Debt to EBITDA | 673.89% | 444.29% | 0% |
| Current Ratio | 45.87% | 29.08% | 0% |
| Quick Ratio | 41.27% | 24.71% | 0% |
Present balance sheet intricates the financial strategy at fascinating risk levels, intensified through multiple financial channels.
Fundamental Strength & Profitability 📈
Exploration of core strengths and profitability underpins strategic endeavors to offset absent dividends, aligning capabilities towards essential operations and sustainable economic principles.
| 2023 | 2024 | 2025 | |
|---|---|---|---|
| Return on Equity | -1.08% | 20.71% | 0% |
| Return on Assets | -0.15% | 3.91% | 0% |
| Net Margin | -0.34% | 7.66% | 10.37% |
| Gross Margin | 33.70% | 37.50% | 40.09% |
| Research & Development to Revenue | 0% | 0% | 0% |
Increase in core efficiency and profitability stands as a notable highlight in ensuring dependable business finitiveness and shareholder wealth.
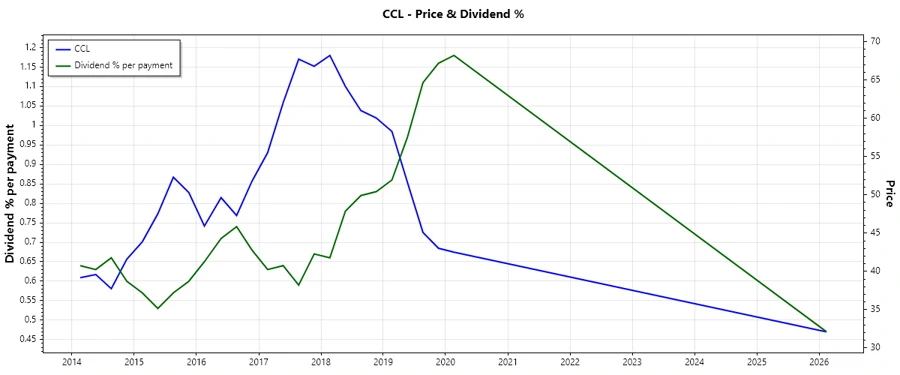
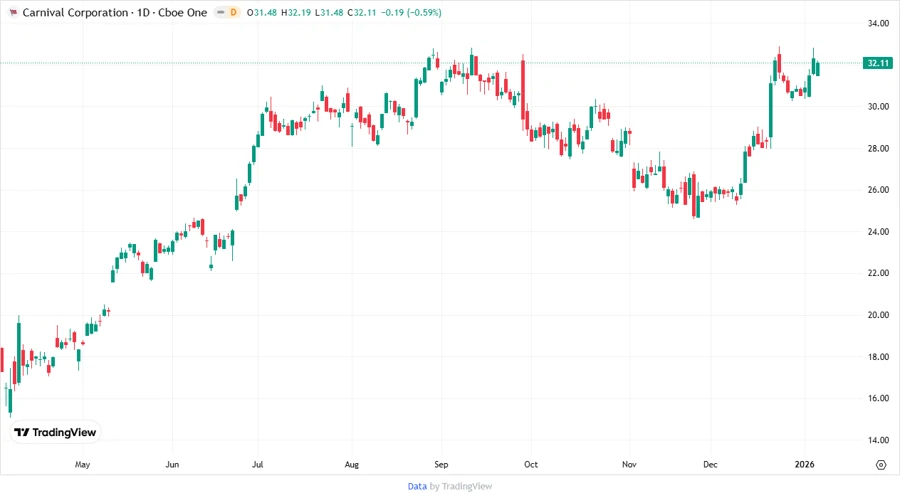
Price Development 📉
Dividend Scoring System ⚠️
| Category | Score | Rating |
|---|---|---|
| Dividend Yield | 0 | |
| Dividend Stability | 2 | |
| Dividend Growth | 1 | |
| Payout Ratio | 1 | |
| Financial Stability | 2 | |
| Dividend Continuity | 3 | |
| Cashflow Coverage | 2 | |
| Balance Sheet Quality | 1 |
Overall Score: 12/40
Rating 🗣️
Carnival Corporation & plc is in the midst of a financial repositioning effort. While its dividend strategy has historically been strong, current circumstances necessitate rectifying internal processes and reinforcing its balance sheet before restoring shareholder rewards. Investors should adopt a cautious approach as financial stability is rebuilt.