August 18, 2025 a 01:15 pm

CBRE: Trend and Support & Resistance Analysis - CBRE Group, Inc.
CBRE Group, Inc., a global leader in commercial real estate services and investments, has shown remarkable resilience across various market conditions. The company operates through segments, including Advisory Services, Global Workplace Solutions, and Real Estate Investments. The recent price movements indicate defined trends and price zones, essential for investors and analysts monitoring the commercial real estate sector. By understanding these historical price components, stakeholders can anticipate potential opportunities or risks.
Trend Analysis
| Date | Closing Price | Trend |
|---|---|---|
| 2025-08-15 | $158.93 | ▲ |
| 2025-08-14 | $158.54 | ▲ |
| 2025-08-13 | $159.66 | ▲ |
| 2025-08-12 | $156.12 | ▼ |
| 2025-08-11 | $153.49 | ▼ |
| 2025-08-08 | $155.40 | ▼ |
| 2025-08-07 | $154.36 | ▼ |
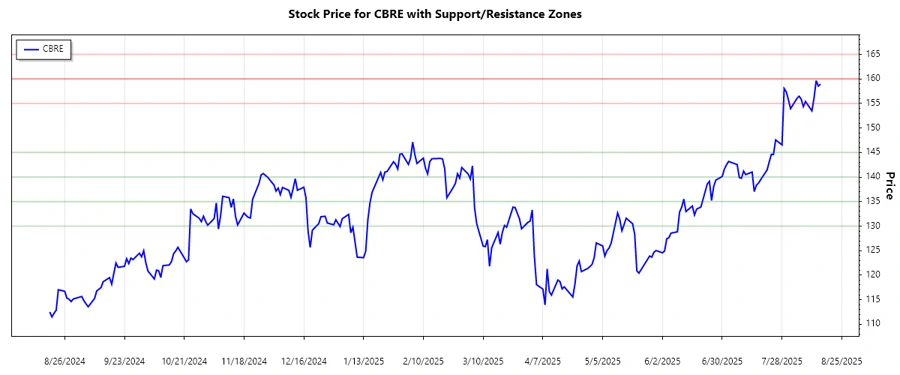
Based on EMA analysis, the recent prices indicate an uptrend as the EMA20 is consistently above the EMA50. This suggests positive investor sentiment towards CBRE’s growth prospects.
Support and Resistance
| Zone | Level |
|---|---|
| Support 1 | $140.00 - $145.00 |
| Support 2 | $130.00 - $135.00 |
| Resistance 1 | $160.00 - $165.00 |
| Resistance 2 | $155.00 - $160.00 |
Currently, CBRE’s stock price is nearing the upper resistance zone, suggesting potential short-term challenges in breaking through the $160.00 level. Monitoring how the price interacts with these zones can provide insights into future price action.
In conclusion, CBRE's recent technical data signifies an upward trend, indicating growth momentum. However, challenges persist near the $160.00 resistance level. For investors, this represents a potential breakout opportunity, though caution is advised given macroeconomic uncertainties. The support levels offer a safety net, suggesting foundational strength within CBRE’s financial ecosystem. This analysis highlights crucially defined technical markers, beneficial for strategizing future investment decisions in the dynamic commercial real estate market.
Smart Data Insight
Master the Perfect Entry & Exit for this Stock
Don't leave your profits to chance. Historically, this stock follows specific seasonal patterns that institutional traders use to maximize returns.
- ✅ Identify the "Golden Buying Window"
- ✅ Avoid high-risk correction cycles
- ✅ Backtested data from the last 20+ years