December 04, 2025 a 10:15 am

CBRE: Fibonacci Analysis - CBRE Group, Inc.
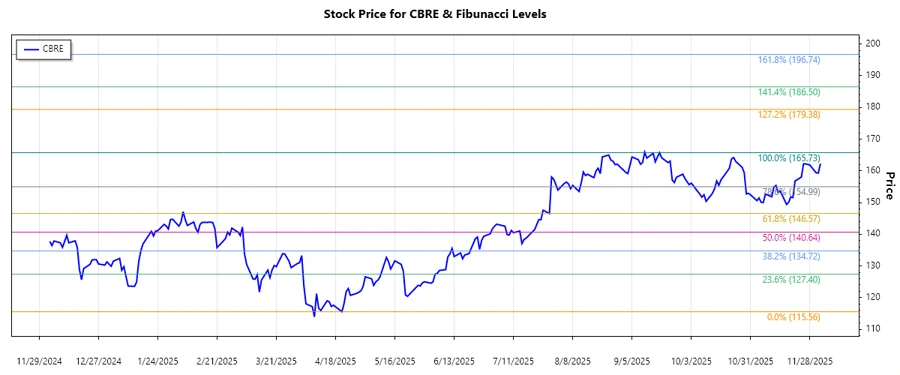
CBRE Group, Inc. has shown strong resilience and adaptability in the commercial real estate market. With its diversified services across various segments such as Advisory Services, Global Workplace Solutions, and Real Estate Investments, the company is well-positioned to capitalize on market opportunities. Recent market behavior suggests a need for caution as the stock might be entering a technical correction phase.
Fibonacci Analysis
| Information | Details |
|---|---|
| Trend Start Date | 2025-05-23 |
| Trend End Date | 2025-12-03 |
| High Price | 165.73 on 2025-09-18 |
| Low Price | 115.56 on 2025-04-21 |
| Fibonacci Levels | |
| 0.236 | 131.03 |
| 0.382 | 138.45 |
| 0.5 | 145.64 |
| 0.618 | 152.84 |
| 0.786 | 161.76 |
| Current Retracement Zone | None (currently above 161.76) |
| Technical Interpretation | The stock is currently trending above the key Fibonacci zones, indicating strong upward momentum. However, should prices decline to the 161.76 level, it may act as significant support. |
Conclusion
CBRE Group, Inc. remains a strong contender in the commercial real estate sector, leveraging its extensive service offerings to maintain a competitive edge. While recent price behavior suggests upward momentum, vigilance is recommended as the stock nears previously identified resistance levels. Analysts should monitor potential retracement to Fibonacci support zones, which could serve as future buying opportunities. The overall trend suggests optimism, but mindful attention to market shifts and external economic conditions is warranted to mitigate risks effectively.