August 16, 2025 a 10:15 am
CBRE: Fibunacci Analysis - CBRE Group, Inc.
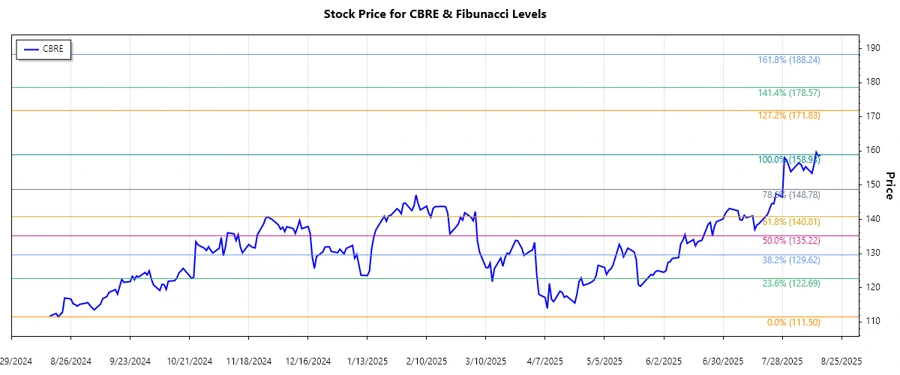
The CBRE Group, Inc., a prominent name in commercial real estate services, has shown a consistent trend over recent months. Analysts should note the prevailing uptrend, with key support levels becoming evident in the light of the rising price movements. This examination provides insight into potential retracement levels and their influence on future stock performance.
Fibonacci Analysis
| Data Point | Value |
|---|---|
| Start Date | 2024-08-19 |
| End Date | 2025-08-15 |
| High (Date) | 158.93 (2025-08-15) |
| Low (Date) | 111.5 (2024-08-20) |
| Fibonacci Level - 23.6% | 123.71 |
| Fibonacci Level - 38.2% | 131.39 |
| Fibonacci Level - 50% | 135.21 |
| Fibonacci Level - 61.8% | 139.03 |
| Fibonacci Level - 78.6% | 144.21 |
| Current Price | 158.93 |
| Retracement Zone | None |
| Interpretation | The current price exceeds the highest Fibonacci retracement level, indicating a strong bullish trend with potential resistance at higher levels. |
Conclusion
The CBRE stock demonstrates a robust upward trend, which is further supported by its current price exceeding typical Fibonacci retracement levels. This suggests strong investor confidence and a potential continuation of the upward momentum. However, any downturn could revisit established Fibonacci levels acting as support if market conditions change. Investors should remain cautious of volatility, particularly if external market pressures affect commercial real estate demand. Overall, CBRE Group presents a favorable outlook, but monitoring is essential for sustained profitability.
Smart Data Insight
Master the Perfect Entry & Exit for this Stock
Don't leave your profits to chance. Historically, this stock follows specific seasonal patterns that institutional traders use to maximize returns.
- ✅ Identify the "Golden Buying Window"
- ✅ Avoid high-risk correction cycles
- ✅ Backtested data from the last 20+ years