
July 25, 2026 a 02:03 pm


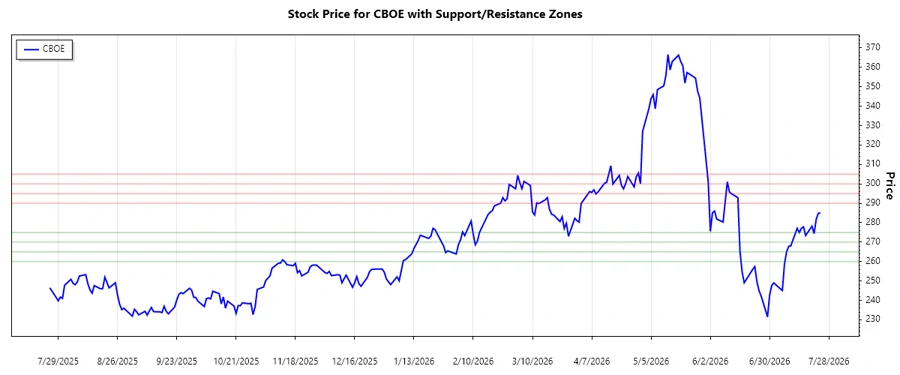
CBOE: Trend and Support & Resistance Analysis - Cboe Global Markets, Inc.
The analysis of Cboe Global Markets (CBOE) reveals insights into its recent price movements and patterns. The stock has shown a mix of dynamic changes, reflecting the company's diverse operation in the global financial exchange sector. Understanding these trends is crucial for making informed investment decisions concerning CBOE's potential as a financial instrument. With regards to support and resistance, these levels might offer strategic entry or exit points for traders. Utilizing technical indicators such as moving averages can further enhance the reliability of these insights.
Trend Analysis
The trend analysis based on the recent CBOE closing prices indicates a prevailing pattern. By calculating the Exponential Moving Averages (EMA) of 20 and 50 days, we derive the following results:
| Date | Closing Price | Trend |
|---|---|---|
| 2026-07-24 | $285.07 | ▲ |
| 2026-07-23 | $284.86 | ▲ |
| 2026-07-22 | $281.80 | ▲ |
| 2026-07-21 | $274.40 | ▲ |
| 2026-07-20 | $278.21 | ▲ |
| 2026-07-17 | $273.41 | ▲ |
| 2026-07-16 | $277.89 | ▲ |
The current trend direction is upward, as indicated by the EMA20 being greater than the EMA50. This suggests a positive sentiment and potential price appreciation in the near term.
Support and Resistance
Support and resistance zones are critical in determining potential entry and exit points. Based on the historical data, the calculated zones are as follows:
| Zone Type | From | To |
|---|---|---|
| Support Zone 1 | $260.00 | $265.00 |
| Support Zone 2 | $270.00 | $275.00 |
| Resistance Zone 1 | $290.00 | $295.00 |
| Resistance Zone 2 | $300.00 | $305.00 |
Currently, the price is nearing the upper resistance zone, which may act as a potential barrier to further price increases.
Conclusion
The current analysis of Cboe Global Markets (CBOE) indicates a bullish trend, characterized by its upward movement and closeness to resistance levels. While the market shows signs of growth potential, investors should remain cautious of potential pullbacks near resistance zones. The combination of moving averages and support/resistance analysis provides a balanced outlook, leveraging these insights for strategic trading. The presence of key partnerships and segmented diversification strengthens CBOE’s position, but constant monitoring is essential due to market volatility. As CBOE approaches critical levels, decisions should be guided by comprehensive evaluations of market conditions.
Smart Data Insight
Master the Perfect Entry & Exit for this Stock
Don't leave your profits to chance. Historically, this stock follows specific seasonal patterns that institutional traders use to maximize returns.
- ✅ Identify the "Golden Buying Window"
- ✅ Avoid high-risk correction cycles
- ✅ Backtested data from the last 20+ years