March 07, 2026 a 03:15 am
CBOE: Trend and Support & Resistance Analysis - Cboe Global Markets, Inc.
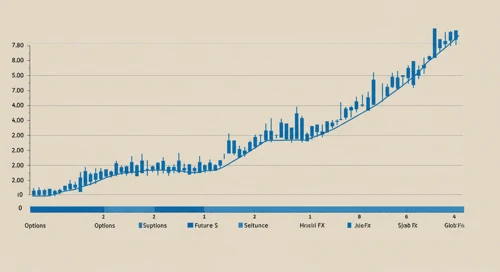
The recent analysis of CBOE's stock shows a significant upward momentum driven by rising options and equities transactions. As the company strengthens its global footprint, investors may find potential in its continued expansion in North American and international markets. However, market volatility and regulatory challenges remain key risks.
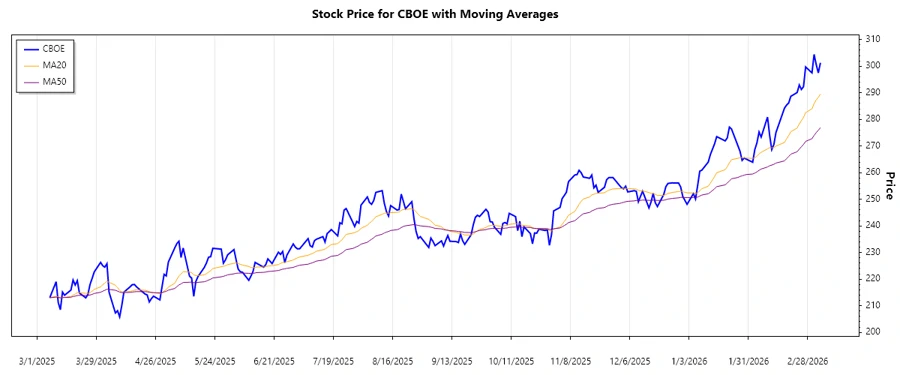
Trend Analysis
| Date | Close Price | Trend |
|---|---|---|
| 2026-03-06 | 301.27 | ▲ |
| 2026-03-05 | 297.49 | ▼ |
| 2026-03-04 | 300.62 | ▲ |
| 2026-03-03 | 304.43 | ▲ |
| 2026-03-02 | 297.49 | ▼ |
| 2026-02-27 | 299.72 | ▲ |
| 2026-02-26 | 292.30 | ▼ |
The EMA20 and EMA50 calculations indicate an overall uptrend, suggesting a positive investor sentiment.
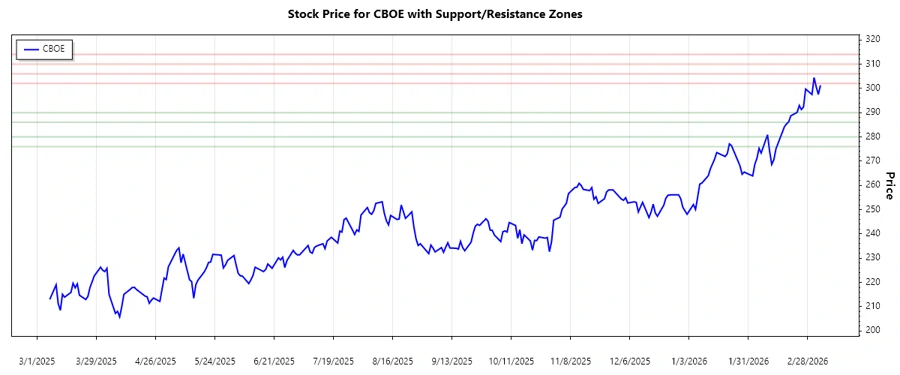
Support and Resistance
| Zone Type | Zone Range |
|---|---|
| Support Zone 1 | 276.00 - 280.00 |
| Support Zone 2 | 286.00 - 290.00 |
| Resistance Zone 1 | 302.00 - 306.00 |
| Resistance Zone 2 | 310.00 - 314.00 |
The current price is within the first resistance zone. This suggests possible profit-taking by traders, but a breakout could indicate further highs.
Conclusion
Cboe Global Markets is showing promising strength in its core segments, resulting in a clear technical uptrend. Opportunities lie in its expanding market reach and strategic partnerships. However, attention must be paid to potential market corrections and macroeconomic factors that could impact its growth strategy. Analysts should continue monitoring the breakout levels for confirming further bullish momentum, ensuring alignment with macroeconomic and sector-specific trends.