September 18, 2025 a 05:15 am
CBOE: Fibonacci Analysis - Cboe Global Markets, Inc.
Cboe Global Markets, Inc. has recently shown an upward trend in its stock price. With robust strategic partnerships and a diversified business model across financial products like options, equities, and futures, the company is well-positioned to manage risks and capitalize on growth opportunities. However, given the dynamic nature of global markets, investors should stay vigilant for market volatility that could impact CBOE's financial performance.
Fibonacci Analysis
| Details | Information |
|---|---|
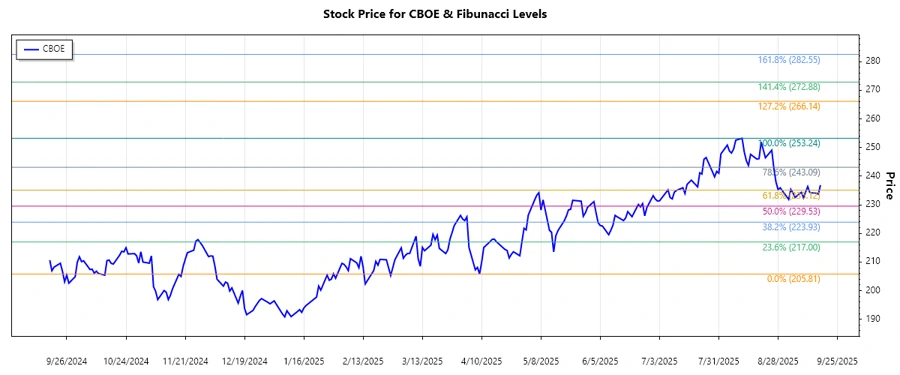
| Trend Start Date | 2025-04-01 |
| Trend End Date | 2025-09-17 |
| High Point | $253.24 on 2025-08-11 |
| Low Point | $205.81 on 2025-04-09 |
| Fibonacci Level | Price Level |
|---|---|
| 0.236 | $240.87 |
| 0.382 | $231.49 |
| 0.500 | $229.52 |
| 0.618 | $221.94 |
| 0.786 | $214.73 |
The current price of $236.89 is in the 0.236 retracement zone, indicating potential resistance near this level. A move above this level might find new support and continue the upward momentum.
Conclusion
The Cboe Global Markets, Inc. stock has experienced an upward trend over the past months, with notable fluctuations in response to global market conditions. The stock's price action in the Fibonacci retracement zone suggests potential areas of support and resistance, providing technical analysts useful markers for decision-making. Investors should balance CBOE's strong market position against the inherent risks of market volatility. Overall, the Fibonacci levels serve as crucial indicators to strategize future buying or selling decisions, anticipating how the stock might navigate through potential market disruptions.
Smart Data Insight
Master the Perfect Entry & Exit for this Stock
Don't leave your profits to chance. Historically, this stock follows specific seasonal patterns that institutional traders use to maximize returns.
- ✅ Identify the "Golden Buying Window"
- ✅ Avoid high-risk correction cycles
- ✅ Backtested data from the last 20+ years