October 01, 2025 a 09:04 am
CAT: Trend and Support & Resistance Analysis - Caterpillar Inc.
Caterpillar Inc., a leader in manufacturing construction and mining equipment, has shown significant stock activity recently. As the market dynamics impact machinery demand, Caterpillar's stock reflects both cyclical and structural shifts in the industry. Recent analyses show a defined pattern with evident support and resistance levels that are crucial for forecasting potential market behavior.
Trend Analysis
| Date | Closing Price | Trend |
|---|---|---|
| 2025-09-30 | 477.15 | ▲ |
| 2025-09-29 | 471.61 | ▲ |
| 2025-09-26 | 465.76 | ▲ |
| 2025-09-25 | 463.72 | ▲ |
| 2025-09-24 | 469.79 | ▲ |
| 2025-09-23 | 471.26 | ▲ |
| 2025-09-22 | 472.10 | ▲ |
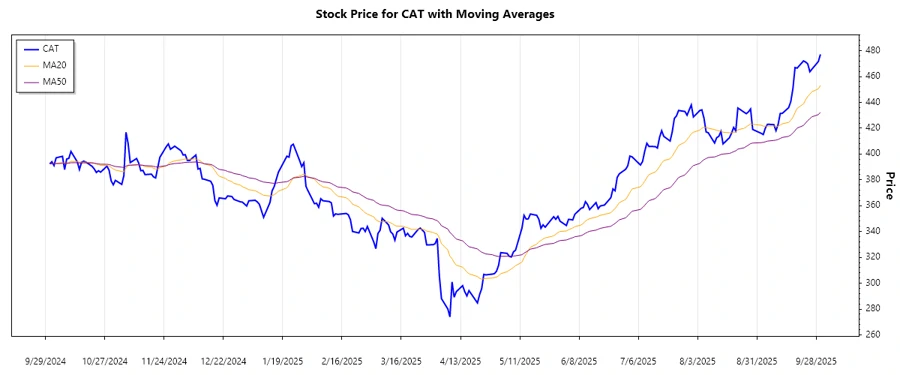
The EMA20 has crossed above the EMA50, indicating a strong upward trend. This suggests potential continued price appreciation.
Support and Resistance
| Zone | From | To |
|---|---|---|
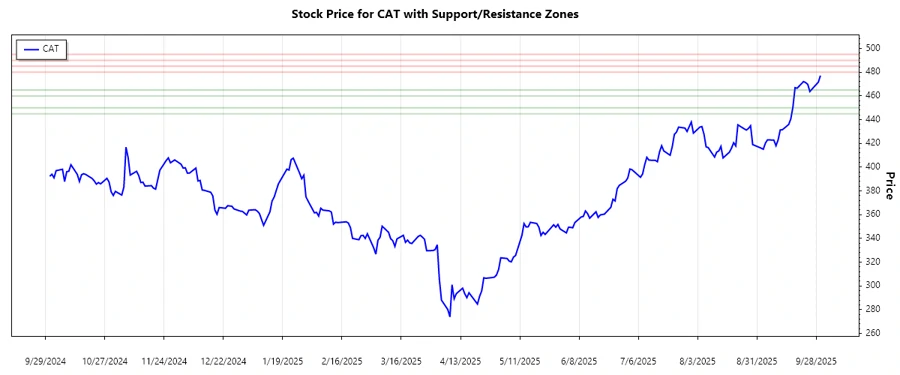
| Support 1 | 445.00 | 450.00 |
| Support 2 | 460.00 | 465.00 |
| Resistance 1 | 480.00 | 485.00 |
| Resistance 2 | 490.00 | 495.00 |
The current price is nearing the lower band of the first resistance zone, indicating a crucial level to watch for potential price rejection or breakthrough.
Conclusion
The trend for Caterpillar Inc. remains upward, as evidenced by the recent EMA cross. Should the price break through resistance levels decisively, further gains could be anticipated. However, investors should remain cautious of the resistance zones that may trigger pullbacks. The support levels offer lower-risk entry points for those looking to capitalize on potential market retracements. Overall, Caterpillar's stock is positioned well, assuming the broader economic conditions remain stable and demand for its sectors continues to align with market expectations.
Smart Data Insight
Master the Perfect Entry & Exit for this Stock
Don't leave your profits to chance. Historically, this stock follows specific seasonal patterns that institutional traders use to maximize returns.
- ✅ Identify the "Golden Buying Window"
- ✅ Avoid high-risk correction cycles
- ✅ Backtested data from the last 20+ years