July 22, 2025 a 08:15 am
CAT: Trend and Support & Resistance Analysis - Caterpillar Inc.
Caterpillar Inc. has showcased remarkable resilience in a dynamic market. Despite industry fluctuations, its recent price movements suggest a potential bullish trend. Analyzing this momentum is crucial for investors aiming to make informed decisions amidst the construction and mining sectors. The company's comprehensive product line continues to fortify its market position, providing substantial opportunities for growth.
Trend Analysis
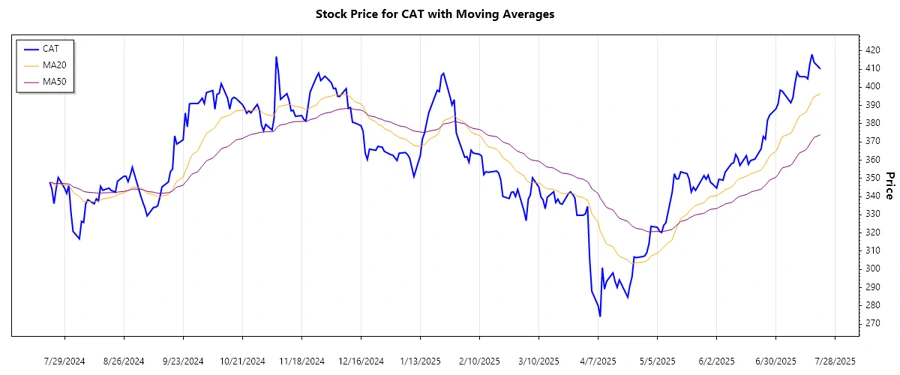
The examination of Caterpillar Inc.'s daily price data reveals a notable upward trend over the analyzed period. From the calculation of the Exponential Moving Averages (EMAs), the EMA20 currently exceeds the EMA50, indicating a strong upward movement. Here is the summary of the last seven daily price observations:
| Date | Closing Price | Trend |
|---|---|---|
| 2025-07-21 | 410.07 | ▲ Up |
| 2025-07-18 | 413.71 | ▲ Up |
| 2025-07-17 | 418.07 | ▲ Up |
| 2025-07-16 | 412.88 | ▲ Up |
| 2025-07-15 | 404.64 | ▲ Up |
| 2025-07-14 | 405.77 | ▲ Up |
| 2025-07-11 | 405.92 | ▲ Up |
The consistent upward movement of the EMA20 above the EMA50 reflects strong buying interest, suggesting a sustained bullish outlook.
Support and Resistance
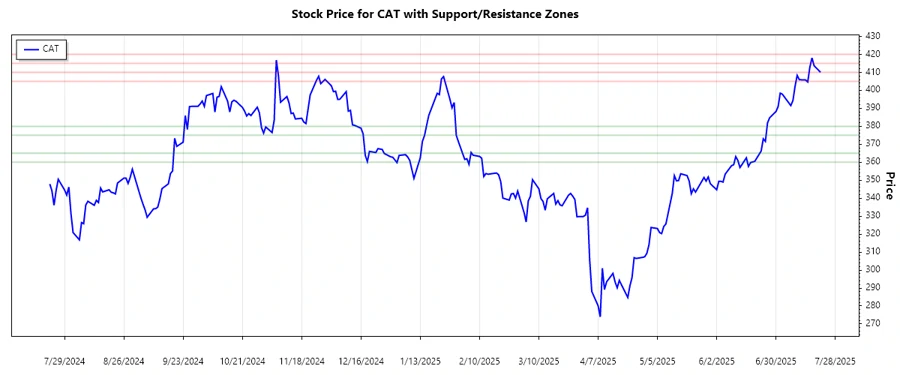
Caterpillar Inc.'s stock has established key support and resistance zones that are critical for potential price action. Based on historical price points, the following zones are evident:
| Zone Type | From | To |
|---|---|---|
| Support Zone 1 | 360.00 | 365.00 |
| Support Zone 2 | 375.00 | 380.00 |
| Resistance Zone 1 | 405.00 | 410.00 |
| Resistance Zone 2 | 415.00 | 420.00 |
The current price is hovering around the lower boundary of the primary resistance zone, indicating a potential breakout if upward momentum continues.
The technical analysis illustrates robust buying interest near the support levels, with resistance testing suggesting potential upside breakout opportunities.
Conclusion
The current analysis shows Caterpillar Inc. is in a favorable position with an upward trend and solid support and resistance levels. The price is close to breaking out of the resistance zone, signifying potential growth prospects. While there are risks if the breakout fails, the possibility for continued upward momentum justifies cautious optimism. Analysts should closely monitor the resistance level interactions to decide on strategic entry points for investments.
Smart Data Insight
Master the Perfect Entry & Exit for this Stock
Don't leave your profits to chance. Historically, this stock follows specific seasonal patterns that institutional traders use to maximize returns.
- ✅ Identify the "Golden Buying Window"
- ✅ Avoid high-risk correction cycles
- ✅ Backtested data from the last 20+ years