March 02, 2026 a 03:31 pm

CAT: Dividend Analysis - Caterpillar Inc.
Caterpillar Inc. has established itself as a strong player in the dividend landscape, thanks to its impressive history of consistent dividend growth and solid payout ratios. The company's strategic focus on maintaining financial stability and efficient cash flow management underpins its capability to sustain and possibly enhance its dividend offerings in the future. Investors looking for long-term dividend growth may find Caterpillar's financial profile appealing given its strategic investments and disciplined capital allocation. However, with a currently modest dividend yield, interested investors may need to weigh income expectations against growth prospects.
Overview
Caterpillar Inc. operates in a vital sector of the economy, showcasing a noteworthy dividend yield and a commendable history of dividend growth, reflecting financial resilience and commitment to shareholder returns.
| Sector | Dividend Yield | Current Dividend per Share | Dividend History | Last Cut or Suspension |
|---|---|---|---|---|
| Industrial Equipment | 0.94% | 5.89 USD | 45 years | None |
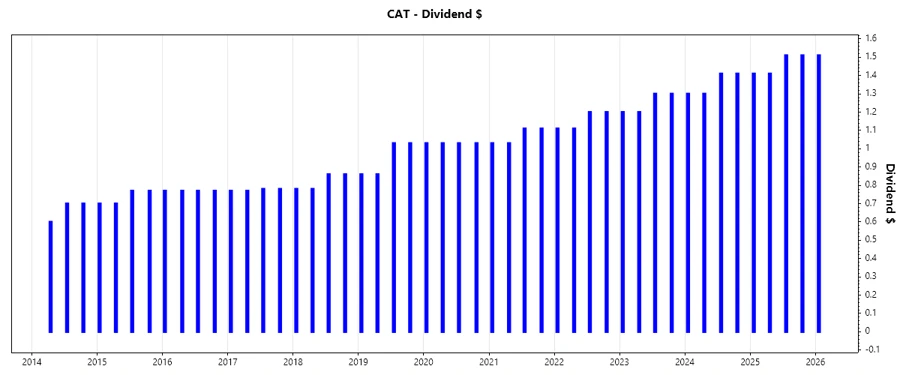
Dividend History
Caterpillar's robust dividend history is a testament to its long-term commitment to creating value for shareholders. An uninterrupted dividend payment over 45 years highlights its operational stability and growth capability. Monitoring dividend history is crucial as it underscores the company's ability to navigate different economic cycles while maintaining shareholder payouts.
| Year | Dividend per Share |
|---|---|
| 2026 | 1.51 |
| 2025 | 5.84 |
| 2024 | 5.42 |
| 2023 | 5.00 |
| 2022 | 4.62 |
Dividend Growth
Dividend growth is an essential metric to gauge a firm's future income potential. Caterpillar showcases strong dividend growth, indicative of its financial health and earnings capability. Steady dividend growth not only attracts income-focused investors but also enhances shareholder value.
| Time | Growth |
|---|---|
| 3 years | 8.12% |
| 5 years | 7.23% |
The average dividend growth is 7.23% over 5 years. This shows moderate but steady dividend growth.
Payout Ratio
Payout ratios provide insights into how much of a company's earnings and cash flow are being returned to shareholders as dividends. Maintaining a balanced payout ratio is crucial for sustaining growth and ensuring financial durability. Caterpillar's EPS-based payout ratio and free cash flow-based ratio demonstrate the company's judicious earnings management.
| Key Figure | Ratio |
|---|---|
| EPS-based | 30.98% |
| Free cash flow-based | 26.84% |
A payout ratio of 30.98% based on EPS and 26.84% based on free cash flow suggest Caterpillar has a comfortable room to increase dividends while maintaining sufficient reserves for future opportunities or challenges.
Cashflow & Capital Efficiency
Cash flow metrics and capital efficiency ratios are critical in evaluating a firm's operational effectiveness and financial health. These metrics, including Free Cash Flow Yield and Earnings Yield, are pivotal for understanding a firm's capability to generate cash relative to its size and capital deployed.
| 2025 | 2024 | 2023 | |
|---|---|---|---|
| Free Cash Flow Yield | 3.84% | 4.99% | 6.49% |
| Earnings Yield | 3.32% | 6.11% | 6.85% |
| CAPEX to Operating Cash Flow | 12.48% | 26.71% | 23.99% |
| Stock-based Compensation to Revenue | 0.36% | 0.34% | 0.31% |
| Free Cash Flow / Operating Cash Flow Ratio | 87.52% | 73.29% | 76.00% |
Caterpillar has managed cash flows effectively, indicating robust cash flow stability and high capital efficiency, which is vital for reinvestment into the business for sustainable growth.
Balance Sheet & Leverage Analysis
The balance sheet and leverage ratios provide a snapshot of Caterpillar's financial stability and debt management capabilities. These figures are essential for evaluating the company's liquidity and gearing levels.
| 2025 | 2024 | 2023 | |
|---|---|---|---|
| Debt-to-Equity | 2.03 | 1.97 | 1.94 |
| Debt-to-Assets | 0.44 | 0.44 | 0.43 |
| Debt-to-Capital | 0.67 | 0.66 | 0.66 |
| Net Debt to EBITDA | 2.24 | 1.97 | 1.97 |
| Current Ratio | 1.44 | 1.42 | 1.35 |
| Quick Ratio | 0.94 | 0.89 | 0.87 |
| Financial Leverage | 4.62 | 4.50 | 4.49 |
The company's leverage position highlights a well-managed debt structure, supporting its operational flexibility while maintaining a healthy liquidity profile.
Fundamental Strength & Profitability
Profitability and fundamental metrics are core indicators of Caterpillar's operating success and strategic positioning. These figures highlight the company's ability to convert revenue into profit efficiently.
| 2025 | 2024 | 2023 | |
|---|---|---|---|
| Return on Equity | 41.62% | 55.37% | 53.02% |
| Return on Assets | 9.00% | 12.30% | 11.81% |
| Margins: Net | 13.13% | 16.65% | 15.41% |
| Margins: EBIT | 18.63% | 21.42% | 20.22% |
| Margins: EBITDA | 21.98% | 24.75% | 23.42% |
| Margins: Gross | 32.34% | 35.99% | 34.69% |
| Research & Development to Revenue | 3.18% | 3.25% | 3.14% |
Caterpillar's robust return metrics affirm its ability to effectively utilize shareholders' capital to generate profits, indicating operational excellence and strong profitability trends.
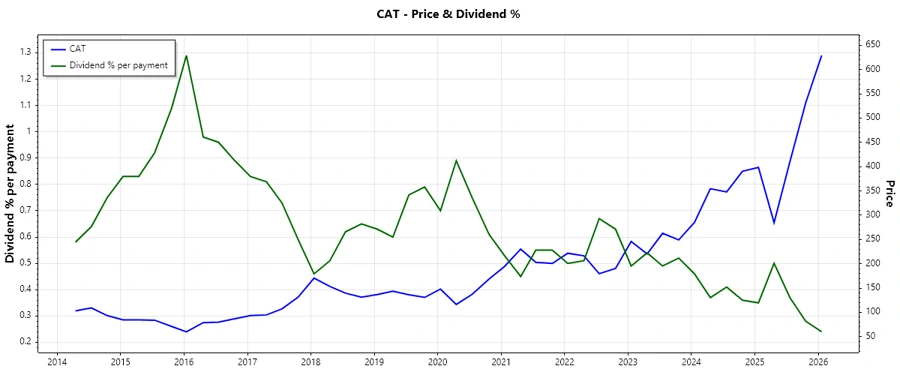
Price Development
Dividend Scoring System
| Criteria | Score | |
|---|---|---|
| Dividend Yield | 3 | |
| Dividend Stability | 5 | |
| Dividend Growth | 4 | |
| Payout Ratio | 4 | |
| Financial Stability | 5 | |
| Dividend Continuity | 5 | |
| Cashflow Coverage | 3 | |
| Balance Sheet Quality | 5 |
Overall Score: 34/40
Rating
Caterpillar Inc. ranks high in dividend stability and financial fortitude. Its substantial dividend history, coupled with sound financial management, underscores a solid investment proposition for dividend-seeking investors. Despite a moderate current yield, the company's historical growth and strategic capital allocation make it a resilient choice for long-term portfolio growth. Considering the overall robust financial health and potential for steady dividends, Caterpillar is recommended as a strong buy for those prioritizing dividend safety and a growth-oriented strategy.
Smart Data Insight
Master the Perfect Entry & Exit for this Stock
Don't leave your profits to chance. Historically, this stock follows specific seasonal patterns that institutional traders use to maximize returns.
- ✅ Identify the "Golden Buying Window"
- ✅ Avoid high-risk correction cycles
- ✅ Backtested data from the last 20+ years