August 23, 2025 a 07:31 am


CAT: Dividend Analysis - Caterpillar Inc.
With its robust financial profile, Caterpillar Inc. stands as a stalwart in the industrial sector. The company boasts a commendable dividend history, reflecting its commitment to shareholders. While facing typical industry headwinds, Caterpillar's conservative payout ratios and historic dividend growth provide a stable outlook for dividend investors.
📊 Overview
Caterpillar Inc., operating in the diverse industrial sector, has demonstrated sustained dividend performance over decades, showcasing a modest dividend yield and a substantial track record of uninterrupted payments since inception.
| Metric | Value |
|---|---|
| Sector | Industrial |
| Dividend Yield | 1.40% |
| Current Dividend per Share | 5.44 USD |
| Dividend History | 44 years |
| Last Cut or Suspension | None |
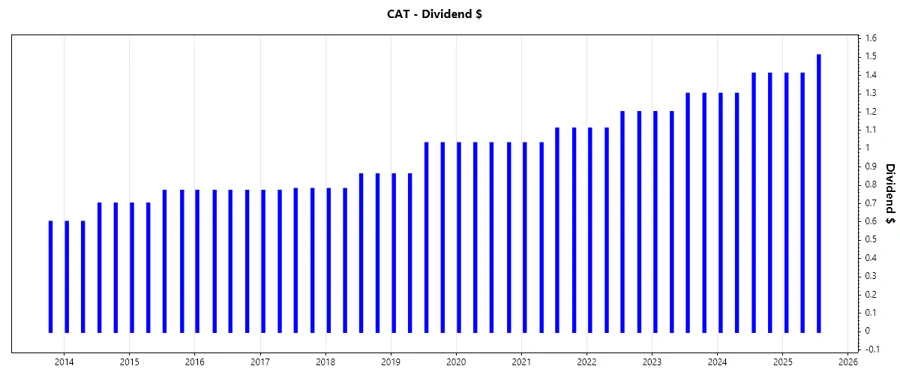
🗣️ Dividend History
Analyzing the historical dividend performance of Caterpillar provides insight into the company's long-term commitment to returning capital to shareholders, withstanding market volatilities and demonstrating fiscal prudence.
| Year | Dividend per Share (USD) |
|---|---|
| 2025 | 4.33 |
| 2024 | 5.42 |
| 2023 | 5.00 |
| 2022 | 4.62 |
| 2021 | 4.28 |
📈 Dividend Growth
Recent dividend growth metrics provide a valuable perspective on Caterpillar's ability to enhance shareholder returns over time. The consistent growth reflects strategic financial management and profit retention.
| Time | Growth |
|---|---|
| 3 years | 8.19% |
| 5 years | 7.47% |
The average dividend growth is 7.47% over 5 years. This shows moderate but steady dividend growth.
💲 Payout Ratio
Payout ratios are crucial in understanding a company's ability to sustain and grow dividends. Caterpillar's low ratios indicate a secure dividend that is backed by both earnings and free cash flow.
| Key Figure Ratio | Value |
|---|---|
| EPS-based | 35.18% |
| Free Cash Flow-based | 28.28% |
With EPS-based and FCF-based payout ratios at 35.18% and 28.28% respectively, Caterpillar maintains a conservative dividend payout, ensuring ample room for future growth even during economic downturns.
🧾 Cashflow & Capital Efficiency
This section covers the efficiency with which Caterpillar utilizes its cashflows and capital, contributing to its ability to pay dividends and sustain operations.
| Measure | 2024 | 2023 | 2022 |
|---|---|---|---|
| Free Cash Flow Yield | 4.99% | 6.49% | 4.09% |
| Earnings Yield | 6.11% | 6.85% | 5.31% |
| CAPEX to Operating Cash Flow | 26.71% | 23.99% | 33.47% |
| Stock-based Compensation to Revenue | 0% | 0% | 0% |
| Free Cash Flow / Operating Cash Flow Ratio | 73.29% | 76.00% | 66.53% |
Caterpillar demonstrates strong cashflow stability and capital efficiency, as shown by substantial free cash flow generation and prudent capital expenditures relative to cash flow. This suggests a balanced strategy towards maintaining liquidity and funding growth initiatives.
🏦 Balance Sheet & Leverage Analysis
An analysis of the balance sheet reveals Caterpillar's leveraging strategy and financial stability, key for understanding its resilience and capacity to meet obligations and fund dividends.
| Measure | 2024 | 2023 | 2022 |
|---|---|---|---|
| Debt-to-Equity | 1.97 | 1.94 | 2.33 |
| Debt-to-Assets | 43.76% | 43.30% | 45.14% |
| Debt-to-Capital | 66.34% | 66.02% | 69.98% |
| Net Debt to EBITDA | 1.97 | 1.97 | 2.63 |
| Current Ratio | 1.34 | 1.35 | 1.39 |
| Quick Ratio | 0.89 | 0.87 | 0.87 |
| Financial Leverage | 4.50 | 4.49 | 5.16 |
Caterpillar maintains a moderate level of leverage as seen in the Debt-to-Equity ratio, indicating a well-balanced approach to using debt for growth while managing financial risks effectively.
📈 Fundamental Strength & Profitability
An examination of profitability metrics illustrates Caterpillar's capacity to generate earnings and return on invested capital, crucial for long-term value creation.
| Measure | 2024 | 2023 | 2022 |
|---|---|---|---|
| Return on Equity | 55.37% | 53.02% | 42.25% |
| Return on Assets | 12.30% | 11.81% | 8.18% |
| Net Margin | 16.65% | 15.41% | 11.28% |
| EBIT Margin | 21.42% | 20.22% | 15.47% |
| Gross Margin | 35.99% | 34.69% | 29.47% |
| R&D to Revenue | 3.25% | 3.14% | 3.05% |
With strong ROE and improving margins, Caterpillar shows effective use of equity and assets to generate profits. The company's consistent investment in R&D supports sustained innovation and competitive advantage.
📉 Price Development
✅ Dividend Scoring System
| Category | Score | |
|---|---|---|
| Dividend Yield | 3 | |
| Dividend Stability | 5 | |
| Dividend Growth | 4 | |
| Payout Ratio | 5 | |
| Financial Stability | 4 | |
| Dividend Continuity | 5 | |
| Cashflow Coverage | 4 | |
| Balance Sheet Quality | 4 |
Overall Score: 34/40
📊 Rating
Overall, Caterpillar Inc. presents a strong investment prospect for dividend-focused investors, with a stable yield, robust financial health, and consistent dividend growth. Despite a relatively low yield, the company's high dividend stability and prudent financial management offer a compelling investment case.
Smart Data Insight
Master the Perfect Entry & Exit for this Stock
Don't leave your profits to chance. Historically, this stock follows specific seasonal patterns that institutional traders use to maximize returns.
- ✅ Identify the "Golden Buying Window"
- ✅ Avoid high-risk correction cycles
- ✅ Backtested data from the last 20+ years