
June 07, 2026 a 07:43 am
CASY: Fundamental Ratio Analysis - Casey's General Stores, Inc.
Casey's General Stores, Inc. operates a chain of convenience stores across the US, providing a mix of ready-to-eat food items, beverages, and fuel among other things. With a stable market presence, CASY represents a robust investment option in the consumer cyclical sector. The company's continuous efforts to expand its distribution network suggest promising growth potential.
Fundamental Rating
The fundamental rating for Casey's General Stores, Inc. indicates a balanced financial health with specific strengths in equity returns.
| Category | Score | Visualization |
|---|---|---|
| Discounted Cash Flow | 3 | |
| Return on Equity | 5 | |
| Return on Assets | 5 | |
| Debt to Equity | 2 | |
| Price to Earnings | 2 | |
| Price to Book | 1 |
Historical Rating
The historical data show a consistent performance with stable fundamental ratios over time.
| Date | Overall | DCF | ROE | ROA | Debt/Equity | P/E | P/B |
|---|---|---|---|---|---|---|---|
| 2026-06-05 | 3 | 3 | 5 | 5 | 2 | 2 | 1 |
| N/A | 0 | 3 | 5 | 5 | 2 | 2 | 1 |
Analysts' Price Targets
Analyst estimates highlight a bullish consensus, reflecting confidence in future price appreciation.
| High | Low | Median | Consensus |
|---|---|---|---|
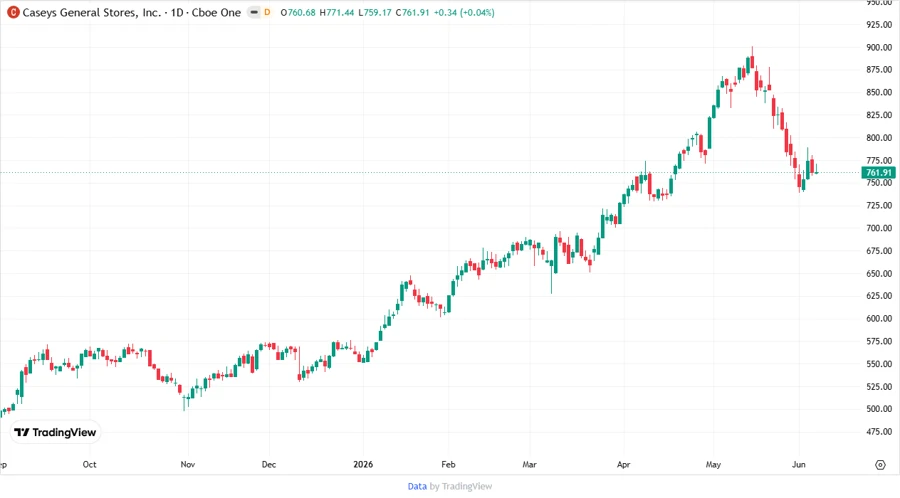
| 915 | 530 | 730 | 755.56 |
Analysts' Sentiment
Current sentiment indicates positive market confidence with a majority leaning towards 'Buy'.
| Recommendation | Count | Distribution |
|---|---|---|
| Strong Buy | 0 | |
| Buy | 15 | |
| Hold | 9 | |
| Sell | 1 | |
| Strong Sell | 0 |
Conclusion
Casey's General Stores, Inc. exhibits a strong fundamental profile with consistent return metrics, anchored by its extensive network of convenience stores. Analysts project a favorable price trajectory, evident by the strong 'Buy' consensus and significant upside potential. However, moderate levels of debt relative to equity and price valuation ratios may present risks if market conditions change. Overall, CASY represents a resilient option within the specialty retail segment, appealing to investors seeking steady returns.
Smart Data Insight
Master the Perfect Entry & Exit for this Stock
Don't leave your profits to chance. Historically, this stock follows specific seasonal patterns that institutional traders use to maximize returns.
- ✅ Identify the "Golden Buying Window"
- ✅ Avoid high-risk correction cycles
- ✅ Backtested data from the last 20+ years