May 23, 2026 a 10:15 am

CASY: Fibonacci Analysis - Casey's General Stores, Inc.
Casey's General Stores, Inc. has shown resilience in the US convenience store market. With solid revenue streams from diverse offerings such as prepared foods and fuel services, the company has maintained consistent growth. Investors are optimistic about its long-term potential, especially considering its strategic expansions and community-centric approach.
Fibonacci Analysis
| Details | Data |
|---|---|
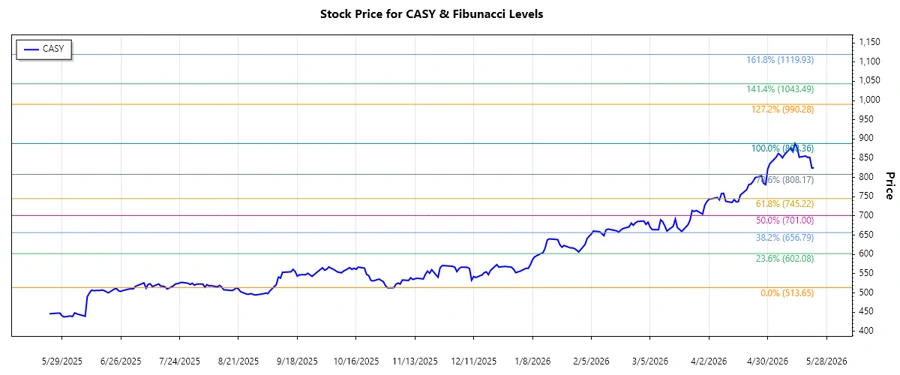
| Trend Type | Upward |
| Start Date | 2025-11-03 |
| End Date | 2026-05-14 |
| High Point | 888.36 (2026-05-13) |
| Low Point | 513.65 (2025-11-03) |
Fibonacci Levels
| Level | Price |
|---|---|
| 0.236 | 664.05 |
| 0.382 | 723.24 |
| 0.500 | 701.00 |
| 0.618 | 778.76 |
| 0.786 | 846.35 |
As of the last data point, the stock is trading at 825.02, which places it within the 0.786 Fibonacci retracement zone. This area typically acts as a strong resistance level.
The current price indicates a potential resistance level, suggesting the stock may consolidate before breaking higher, provided fundamental and market conditions are favorable.
Conclusion
Casey's General Stores, Inc. has exhibited a robust upward trend, reflecting positive investor sentiment and operational efficiency. The current retracement zone suggests a short-term consolidation, offering potential buying opportunities for long-term investors. However, market volatility and sector competition could pose risks. Overall, the stock's performance is encouraging for stakeholders seeking steady returns.
Smart Data Insight
Master the Perfect Entry & Exit for this Stock
Don't leave your profits to chance. Historically, this stock follows specific seasonal patterns that institutional traders use to maximize returns.
- ✅ Identify the "Golden Buying Window"
- ✅ Avoid high-risk correction cycles
- ✅ Backtested data from the last 20+ years