
June 14, 2026 a 11:31 am

CASY: Dividend Analysis - Casey's General Stores, Inc.
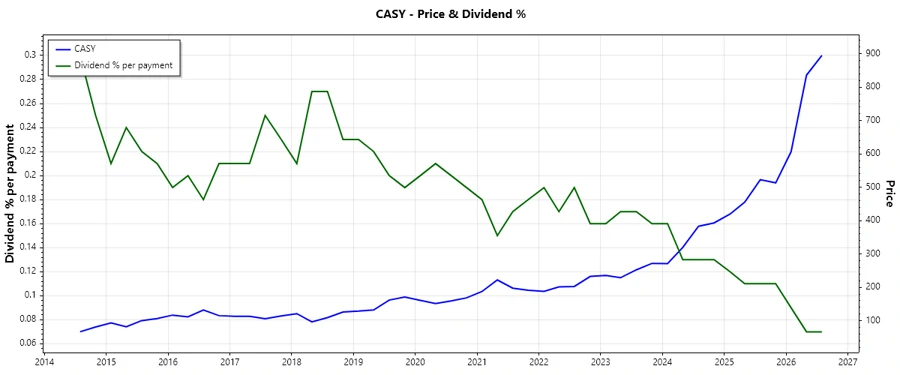
Casey's General Stores, Inc. (CASY), a well-established entity within the convenience store sector, exhibits a conservative dividend profile with moderate growth potential. The company's consistent dividend payments over the past 37 years highlight its commitment to rewarding shareholders. However, with a dividend yield of approximately 0.26%, income-seeking investors may prioritize other opportunities with higher yields. Notably, CASY's efficient payout ratios and sturdy financial health suggest sustainable dividend distributions going forward.
📊 Overview
Casey's General Stores stands as a stalwart in the convenience store industry, providing a consistently rewarding dividend history, underscored by an impressive 37-year track record without cuts. As of recent data, the company's dividend yield stands at 0.26%, with a current dividend per share of $2.24 USD. These metrics solidify CASY’s reputation for steady if not exceptionally high-yielding dividends.
| Metric | Value |
|---|---|
| Sector | Consumer Discretionary |
| Dividend Yield | 0.26% |
| Current Dividend per Share | $2.24 |
| Dividend History | 37 years |
| Last Cut or Suspension | None |
🗣️ Dividend History
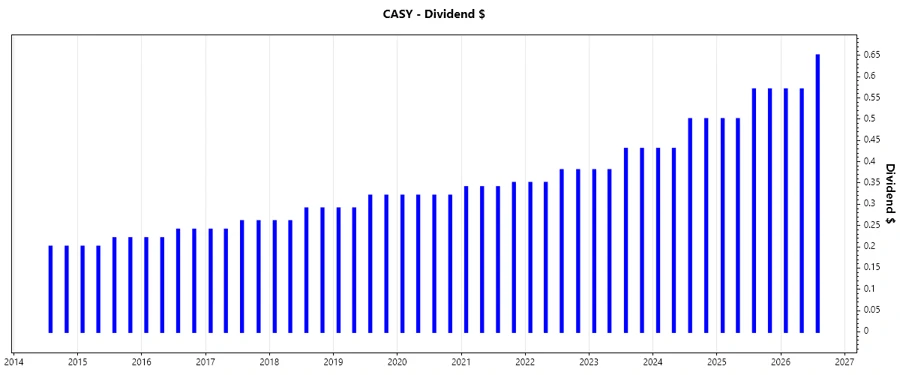
Reviewing historical dividend data is crucial for investors assessing a company's reliability and predictability in income streams. Casey's has consistently increased its dividend distributions over the years, which is a hallmark of strong corporate governance and financial health.
| Year | Dividend Per Share (USD) |
|---|---|
| 2026 | 1.79 |
| 2025 | 2.14 |
| 2024 | 1.86 |
| 2023 | 1.62 |
| 2022 | 1.46 |
📈 Dividend Growth
An analysis of dividend growth provides insight into the company's capacity to sustain its income payouts and potential to increase them. Over the past three and five years, Casey’s showed a dividend growth rate of 13.59% and 10.83%, respectively.
| Time | Growth |
|---|---|
| 3 years | 13.59% |
| 5 years | 10.83% |
The average dividend growth is 10.83% over 5 years. This shows moderate but steady dividend growth.
✅ Payout Ratio
Payout ratios are critical for assessing the sustainability of dividend payments. A lower payout ratio implies a greater margin of safety for future dividends.
| Key Figure | Ratio |
|---|---|
| EPS-based | 11.64% |
| Free Cash Flow-based | 11.52% |
The payout ratio of 11.64% (EPS) and 11.52% (FCF) indicates a very conservative distribution strategy, suggesting ample room for future increases without compromising financial stability.
📝 Cashflow & Capital Efficiency
Evaluating the cash flow and capital efficiency is essential for understanding a company's ability to generate cash and utilize capital effectively. These factors directly inform a firm's capability to cover dividends and invest strategically.
| Year | 2026 | 2025 | 2024 |
|---|---|---|---|
| Free Cash Flow Yield | 2.37% | 3.41% | 3.12% |
| Earnings Yield | 2.34% | 3.18% | 4.23% |
| CAPEX to Operating Cash Flow | 47.62% | 46.41% | 58.46% |
| Stock-based Compensation to Revenue | 0.36% | 0.30% | 0.28% |
| Free Cash Flow / Operating Cash Flow Ratio | 52.38% | 53.59% | 41.54% |
The positive cash flow metrics indicate a healthy generation of cash relative to operational needs, reflecting wise fiscal management and potential for reinvestment and dividend coverage.
📄 Balance Sheet & Leverage Analysis
A thorough balance sheet and leverage analysis reveals insights into a company’s financial stability and its capital structure. These metrics help investors gauge the risk associated with the company's debt levels.
| Year | 2026 | 2025 | 2024 |
|---|---|---|---|
| Debt-to-Equity | 0.84 | 0.84 | 0.58 |
| Debt-to-Assets | 0.37 | 0.35 | 0.28 |
| Debt-to-Capital | 0.46 | 0.46 | 0.37 |
| Net Debt to EBITDA | 2.01 | 2.17 | 1.44 |
| Current Ratio | 1.01 | 0.92 | 0.87 |
| Quick Ratio | 0.60 | 0.48 | 0.42 |
| Financial Leverage | 2.26 | 2.40 | 2.11 |
Casey’s moderate leverage ratios and coverage metrics suggest robust financial health, enabling it to manage debt obligations effectively while investing in growth opportunities.
📉 Fundamental Strength & Profitability
An insight into fundamental strength and profitability ratios highlights how well a company is utilizing its resources to generate returns. These key metrics are vital for assessing operational efficiency and overall financial health.
| Year | 2026 | 2025 | 2024 |
|---|---|---|---|
| Return on Equity | 18.08% | 15.58% | 16.65% |
| Return on Assets | 8.00% | 6.48% | 7.91% |
| Net Margin | 4.07% | 3.43% | 3.38% |
| EBIT Margin | 5.34% | 5.08% | 4.85% |
| EBITDA Margin | 7.89% | 7.61% | 7.21% |
| Gross Margin | 24.61% | 23.54% | 22.53% |
| Research & Development to Revenue | 0% | 0% | 0% |
The consistent profitability ratios highlight Casey’s ability to convert revenue into profits efficiently, bolstering its reputation as a fundamentally sound investment.
📊 Price Development
🏆 Dividend Scoring System
| Category | Score | Score Bar |
|---|---|---|
| Dividend Yield | 2 | |
| Dividend Stability | 5 | |
| Dividend Growth | 4 | |
| Payout Ratio | 5 | |
| Financial Stability | 4 | |
| Dividend Continuity | 5 | |
| Cashflow Coverage | 3 | |
| Balance Sheet Quality | 4 |
Total Score: 32/40
📝 Rating
In conclusion, Casey's General Stores offers an appealing dividend profile for investors seeking stability and moderate growth. While not the highest-yielding option, CASY's history of dividend consistency, coupled with strong financial health and prudent payout ratios, make it a commendable choice for long-term, risk-averse investors. Recommended for inclusion in a diversified income-focused portfolio.
Smart Data Insight
Master the Perfect Entry & Exit for this Stock
Don't leave your profits to chance. Historically, this stock follows specific seasonal patterns that institutional traders use to maximize returns.
- ✅ Identify the "Golden Buying Window"
- ✅ Avoid high-risk correction cycles
- ✅ Backtested data from the last 20+ years